Adsight Scalable And Accurate Quantification Of User Attention In Multi Slot Sponsored Search
Abstract
Section titled “Abstract”Modern Search Engine Results Pages (SERPs) present complex layouts where multiple elements compete for visibility. Attention modelling is crucial for optimising web design and computational advertising, whereas attention metrics can inform ad placement and revenue strategies. We introduce AdSight, a method leveraging mouse cursor trajectories to quantify in a scalable and accurate manner user attention in multi-slot environments like SERPs. Ad-Sight uses a novel Transformer-based sequence-to-sequence architecture where the encoder processes cursor trajectory embeddings, and the decoder incorporates slot-specific features, enabling robust attention prediction across various SERP layouts. We evaluate our approach on two Machine Learning tasks: (1) regression, to predict fixation times and counts; and (2) classification, to determine some slot types were noticed. Our findings demonstrate the model’s ability to predict attention with unprecedented precision, offering actionable insights for researchers and practitioners.
Keywords
Section titled “Keywords”SERP; Sponsored search; Online advertising; Mouse cursor tracking; Multi-slot ads; Direct displays; User attention; Neural networks, Information systems → Search interfaces; Sponsored search advertising; • Computing methodologies → Modeling and simulation.
1 Introduction
Section titled “1 Introduction”The evolution of the Web has had a significant impact on how saliency and attention are both understood and computed. Initially, the Web consisted primarily of static HTML pages featuring mostly text and basic hyperlinks. Saliency was mainly determined by textual content, ignoring the layout. Over time, the incorporation of visual elements like images, logos, banners, and basic animations increased the complexity of web layouts. Thus, saliency considerations expanded to include user attention patterns. The Web 2.0 brought another paradigm shift, introducing dynamic and usergenerated content. Social media platforms emerged and websites became further convoluted in layout and functionality. This evolution increased the number of elements competing for user attention, making its computation more crucial for effective web design.
Currently, new challenges and opportunities arise, such as: (1) the increased use of video, audio, and interactive elements, creating more complex visual hierarchies; (2) the adoption of responsive designs, requiring considering diverse screen sizes and devices; and (3) the variability in user attention patterns, even when viewing the same visual stimuli. The interplay between cognitive processes, such as reading, and the competition among visual elements further compounds the problem of attention prediction in environments with diverse layouts [17].
These challenges have implications for search engines and social media, where advertising revenue funds many free online services. For example, ads generate around one third of the advertising revenue for major search engines, totalling approximately $50 billion annually [25]. Modern SERPs incorporate elements such as snippets, one-box answers, and side panels, creating non-trivial patterns of user attention. Such configurations can result in “good abandonments”, where users find information without clicking, complicating the assessment of user satisfaction [19] or display noticeability [14].
Accurate attention prediction is essential for optimizing computational advertising. It enables strategic ad placements that enhance visibility and reduce intrusive experiences, potentially increasing ad effectiveness. Furthermore, as search engines adopt conversational interfaces, opportunities emerge for integrating native advertising within generative search results, blending product placements with organic responses [69]. Attention prediction also offers significant potential for advancing digital advertising models, such as the pay-per-attention (PPA) auction scheme [8], which considers attention likelihood rather than mere clicks or ad impressions. While
diagnostic technologies [6] can improve our understanding of user engagement and inform smarter auction models, existing solutions remain limited, as they consider single ads in isolation. We address these key challenges with the following contributions:
- A novel and scalable method to quantify user attention from mouse movements in multi-slot environments like SERPs.
- A Transformer-based sequence-to-sequence (Seq2Seq) model, where the encoder processes cursor trajectory embeddings and the decoder incorporates slot-specific features.
- Demonstration of the utility of AdSight as a scalable and accurate attention measurement method through two Machine Learning (ML) tasks, namely (1) Regression: Predicting fixation times and counts with near-second precision; and (2) Classification: Identifying whether a user has noticed some advertisements. Both tasks utilise ground truth from organic eye tracking data.
- Exploration of cursor data representations and embeddings, showing how auxiliary slots can serve as additional Areas of Interests (AOIs) to enhance model learning.
2 Related work
Section titled “2 Related work”The analysis of mouse cursor trajectories and their temporal dynamics have offered powerful insights into the underlying cognitive processes of many everyday tasks such as e-shopping [32]. Actually, the first applications of mouse tracking can be traced to web browsing analysis [18, 55]. Experimental psychology and cognitive science research have also tapped into mouse movement analysis to study for example consumer’s choice [62, 68], decision-making processes [51, 64], and motor control performance [61].
Historically, in Information Retrieval (IR), eye tracking has been used to study user behaviour [3, 13, 26, 47, 56]. However, eye tracking requires specialized equipment and is typically confined to lab settings. On the contrary, mouse tracking requires no dedicated equipment or extensive training and can be deployed online, in a cost-effective and scalable manner, while users browse within their natural environment [46]. Further, mouse movements are considered as a reasonable proxy for user’s gaze, especially on SERPs [5, 29, 35, 37, 44, 63], highlighting mouse tracking as scalable alternative to eye tracking [31, 33, 37]. Applications of mouse tracking in IR include: inform usability tests [9], predict user engagement [4] and intent [27, 53], detect searcher frustration [24] and page abandonment [14, 22], or identify open-ended behaviours [38].
2.1 User Modelling
Section titled “2.1 User Modelling”Tracking where on the page a user’s mouse cursor hovers or clicks provides a surrogate signal for gaze fixation, revealing the focus of attention, which can be used to learn the users’ latent interests.
2.1.1 Inferring User Interest. Early work considered simple, coarsegrained features derived from mouse cursor data to be reasonable measurements of user interest [20, 60]. Follow-up research transitioned to more fine-grained mouse cursor features [27, 28] that were shown to be more effective. These approaches have been directed at predicting open-ended tasks like search success [30] or search satisfaction [48]. In a similar vein, Huang et al. [36, 37] modeled mouse cursor interactions and extended click models to compute more accurate relevance judgements of search results.
2.1.2 Inferring Visual Attention. Mouse cursor tracking has been also used to survey the visual focus of users, thus revealing valuable information regarding the distribution of user attention over the various SERPs components. Despite the technical challenges that arise from this analysis, previous work has shown the utility of mouse movement patterns to predict reading [34] or hesitations [55]. Lagun et al. [42]introduced the concept of motifs, or frequent cursor subsequences, in the estimation of search result relevance. Similarly, Liu et al. [48] applied the motifs concept to SERPs and predicted search result utility, searcher effort, and satisfaction at a search task level. Boi et al. [12] proposed a method for predicting whether the user is looking at the content pointed by the cursor, exploiting the mouse cursor data and a segmentation of the contents in a web page. Lastly, Arapakis et al. [5, 8] investigated user engagement with direct displays on SERPs, supporting the utility of mouse cursor data for measuring display-level user attention. They proposed a pay-per-attention scheme, where advertisers are charged only when users noticed the ads shown on SERPs.
2.1.3 Inferring Personally Identifiable Information. The link between mouse cursor movements and psychological states has been researched since the early 90s [1, 16]. Some studies explored the utility of mouse cursor data for predicting the user’s emotional state [39, 70], including frustration [10, 40] and anxiety [66]. This led to profiling applications, such as decoding age and gender [41, 57, 67], highlighting privacy concerns from unethical and unregulated mouse cursor tracking [45].
2.2 Sponsored Search
Section titled “2.2 Sponsored Search”Commercial search engines have been interested in how users interact with SERPs, to anticipate better ad placement in sponsored search or optimize the page layout. Earlier models of scanning behaviour in SERPs were assumed to be linear, as users tend to explore the search results from top to bottom. Today this is no longer the case, since SERPs now include several heterogeneous modules (direct displays) like image and video search results, featured snippets, or feature-rich ads [7, 58, 59]. To account for this heterogeneity, Diaz et al. [21] proposed a generalization of the classic linear scanning model which incorporated ancillary page modules, whereas Huang et al. [36] and Speicher et al. [63] modelled mouse cursor interactions by extending click models to compute more accurate relevance judgements of search results. Liu et al. [50] noticed that almost half of the search results fixated by users are not being read, since there is often a preceding skimming step in which users quickly look at the page structure. Based on this observation, they propose a two-stage examination model: a first “from skimming to reading” stage and a second “from reading to clicking” stage. Interestingly, they showed that both stages can be predicted from mouse cursor movements.
The closest work to ours is by Arapakis et al. [5, 6, 8], who investigated user engagement with direct displays on SERPs, one element (slot) at a time. Similarly, we implement a diagnostic technology for measuring user attention to slots. However, our work differs in two key aspects. First, we propose a novel predictive modelling framework based on Transformers for detecting attention to multiple slots, including organic and direct-display ads, in various positions, within Google SERPs. Second, we use eye tracking to
collect objective ground-truth labels of user attention, weighing AOIs in SERPs for enhanced mouse movement analysis. To our knowledge, we are the first to introduce this methodology.
3 User study
Section titled “3 User study”3.1 Participants
Section titled “3.1 Participants”A total of 47 participants (20 F, 25 M), aged 19–44 years (M=29.66, SD=6.46) were recruited via mailing lists and provided written consent before the experiment. All participants had normal or corrected-to-normal vision and self-reported being proficient in English. Compensation was 20 EUR.
3.2 Design
Section titled “3.2 Design”We designed a between-subjects experiment with two independent variables: (1) slot format (organic and direct-display ads) and (2) slot position (direct-display ads placed on the top-left or top-right part, and organic ads placed at the top or bottom). The dependent variable was user attention, measured via gaze fixations.
3.3 Procedure
Section titled “3.3 Procedure”The experiment was divided into eight blocks, each comprising 10 trials. The first two blocks (not considered for analysis) were used as warm-up tasks to help participants familiarize themselves with the procedure. Each trial comprised an independent transactional task. The eye-tracker was recalibrated before the start of every block. Participants were given a rest period of at least one minute between blocks. At the beginning of each trial, participants were presented with a product title and an associated query text. They were instructed to imagine they were planning to purchase that product and then navigated to the SERPs. They had up to one minute to review the results and click on whatever item they would typically choose in those circumstances. After making their selection, participants were asked to confirm their choice. If they chose not to confirm, they could continue browsing for another minute.
3.4 Apparatus
Section titled “3.4 Apparatus”Equipment. We used a 17-inch Dell 1707FP 1280x1024 px LCD monitor with a refresh rate of 60 Hz. All SERPs were presented in full-screen mode using Google Chrome browser. Eye-tracking data was collected using a Gazepoint GP3 HD eye tracker, operating at a sampling rate of 150 Hz. Mouse movements were captured with a Dell MS116 mouse.
Search Queries. We extracted product titles from the Amazon Product Reviews dataset [54] and used them as queries on Google search by prepending “buy” to each title. This yielded 4,410 distinct SERPs in English, featuring both organic and direct display ads. The SERPs were randomly organised into 10 blocks, 282 of which were eventually included in the study.
SERP Layout. Organic ads appeared either at the top or bottom parts of the SERPs, whereas direct display ads appeared in the upper-left or upper-right parts. Each SERP had either a left-aligned or a right-aligned direct display ad. It could also include organic ads or consist only of organic ads, without any direct display ads.
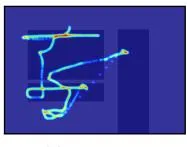
(a) Heatmap (b) Colour trajectories
(c) Colour trajectories and slot-specific colour
Figure 1: Visual representations of mouse movements to train the ViT models, all including slot placeholders.
Dataset. Our final dataset consisted of 2,776 trials, with each trial having four associated files: (1) a rendered full-page screenshot of the corresponding SERP; (2) a ‘slot boundaries’ file containing the bounding box coordinates of ad blocks on the screenshot, (3) an ‘eye fixations’ file in the format (t, x, y, d), where t represents timestamps, x and y denote gaze positions (relative to the top-left corner of the screen), and d indicates fixation duration; (4) a ‘mouse movements’ file in the format (t, x, y, e), where t represents timestamps, t and t denote cursor positions (relative to the top-left corner of the screen), and t refers to mouse actions (e.g., hovers or clicks). For more details, see the associated dataset paper [43].
4 Data representation
Section titled “4 Data representation”We cast the problem of slot attention prediction as two ML tasks: (1) Regression analysis: Can a user’s mouse cursor trajectory predict the total fixation time on a SERP slot or even the number of fixations per slot? (2) Binary classification: Can a user’s mouse cursor trajectory determine whether the user noticed a particular slot?
4.1 Cursor Data
Section titled “4.1 Cursor Data”As we discuss in Section 5, we consider three distinct mouse cursor data embeddings: (1) Transformer-based; (2) Long Short-Term Memory (LSTM)-based; and (3) Vision Transformer (ViT)-based embeddings. The first two methods take as input multivariate time series, whereas the ViT model works with images.
4.1.1 Multivariate Time Series. Each mouse cursor trajectory has four features at each timestep: cursor coordinates (x, y) normalized in the [0, 1] range w.r.t viewport size), time spent at each coordinate, slot type at position, and normalized sequence index. The slot type is a categorical feature that takes values from -1 to 3. A value of -1 indicates that the mouse cursor is positioned outside any slot, while values between 0 and 3 represent positions within specific slot categories (direct-top=0, direct-right=1, organic-top=2, organic-bottom=3). The normalized sequence index is a float in [0,1] that describes the position of a sample within a sequence.
The data are time-ordered, with no consecutively duplicated coordinates. A distinguishing characteristic of this data format is its asynchronous nature: unlike regular time series with constant sampling rates, mouse movement events occur irregularly. This happens because web browser events are first queued and then fired as soon as resources are available [52].
excluded 44 trials due to malformed log files.
<sup>2Other representations (e.g. positional encoding) yielded inferior performance.
Both Transformer and LSTM models process sequential data, but their requirements differ. Specifically, Transformers can handle data sequences of arbitrary and variable lengths so they do not require further data adjustment (e.g., padding). On the contrary, LSTMs require sequences of fixed length. We set the maximum sequence length to 250 timesteps, a value that approximates the mean sequence length plus one standard deviation observed in our data. Shorter sequences are zero-padded to reach the fixed length of 250 timesteps, whereas longer sequences are truncated.
- 4.1.2 Visual Representations. We adopt efficient representations proposed in previous work [6], summarized in Figure 1.
- Heatmap: Mouse coordinates are rendered using a 2D Gaussian kernel with a 25 pixels radius. Overlapping kernels contribute cumulatively to produce aggregated heatmap values.
- Colour trajectories: Mouse trajectories are rendered as lines connecting consecutive coordinates. Each trajectory starts and ends with cursor-shaped markers in green and red colour, respectively. Line colours follow a temperature gradient, transitioning from green at the start to red at the end. Line thickness represents the percentage of time spent, with thicker segments corresponding to earlier parts of the trajectory. All slot boxes are shown in grey.
- Colour trajectories with slot-specific colours: This representation extends the previous one by using a scale of gray colours to better differentiate the slot types.
4.2 Slot Metadata
Section titled “4.2 Slot Metadata”We implement the Seq2Seq model architecture since (1) it accommodates a variable number of slots across different SERPs and (2) facilitates the incorporation of slot-specific features, enhancing both performance and generalisation capabilities. For the regression task, this means that the model translates a sequence of cursor movements into a sequence of predictions, like Total Fixation Time (TFT) or Total Fixation Count (TFC), for each slot. We note that, while the sequence of cursor movements has an inherent meaning, the order of the slots is irrelevant. We verified this assumption by comparing different slot ordering criteria, which yielded the same results (see Section 6.1.2).
Building upon our Seq2Seq model, we implement two features that characterise each slot: (1) normalised position ( and ), and (2) slot type. The normalised position represents the centre of the slot and is normalised to a range of [0, 1] w.r.t viewport size. We explored different ways to parameterize slot positions (see Section 6.1.1) and found this representation to perform best. The slot type is the same categorical feature described in Section 4.1.1.
4.2.1 Auxiliary Slots. As explained in Section 4.1.1, we defined a ‘slot type’ feature that categorises the cursor’s location as being either inside or outside a slot. We noticed that the default category (-1) was not enough to detect whether the mouse cursor is near organic-top or organic-bottom slots. To address this limitation, we introduce auxiliary slots that serve as other AOI, enabling a more detailed categorisation of cursor positions and improving the overall granularity of the data representation. In Section 6.1.4, we explicitly analyse the impact of auxiliary slots, demonstrating their effectiveness in improving model performance, mainly for
two reasons: (1) they refine the characterisation of cursor positions; and (2) they support the learning of meaningful patterns and relationships between fixation events.
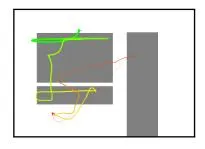
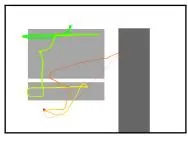
Auxiliary slots are positioned as follows. Initially, the page is divided into two sections: the main area and the right area (see Figure 2). The main area is the vertical region of the web page where search results are displayed, along with direct-top, organic-top, and organic-bottom slots. The right area is the vertical portion of the web page where direct-right slots are located. Next, N auxiliary slots are placed in the main area. Specifically, the space between the end of the last direct-top/organic-top slot and the beginning of the first organic-bottom slot is divided into N equally-sized rectangular regions of interest, ensuring no gaps between them. If the page does not contain direct-top/organic-top or organic-bottom slots, the auxiliary slots span from the top of the web page to the bottom. The value of N is a hyperparameter that can be optimised; in our setting (see Section 6.1.4), the optimal value is N = 3. Finally, for the right area we apply a simpler heuristic. If no direct-right slots are present, two auxiliary slots are placed: one in the upper-middle section and another in the lower-middle section. If direct-right slots are present, an auxiliary slot is positioned below the existing slot.
4.3 Ground Truth
Section titled “4.3 Ground Truth”For both the regression and classification tasks, the ground truth is obtained from the eye-tracker’s fixations. As in the case of mouse movements, fixations are time-ordered, with no consecutively duplicated coordinates.
- 4.3.1 Regression Task. The model is trained to predict either the TFT or the TFC for each slot. Because predictions are made at the slot level, the number of model outputs—and thus the number of targets—varies across SERPs. TFT is computed as the total duration the user spent viewing a specific slot, regardless of whether the fixations occurred consecutively. Conversely, TFC represents the total number of fixations on a specific slot, independent of the duration of each fixation or their sequence. To ensure data quality, events lasting less than 100 ms are excluded from both metrics, following recommendations from prior studies [11, 49].
- 4.3.2 Classification Task. The model predicts whether a user fixated on a specific category of slot. This involves four separate binary classification problems, one per slot category. Unlike in the regression task, where predictions are made at the slot level, the classification task produces predictions at the category level (e.g. all direct-top slots). The target labels are created as follows:
- Cluster/Density Detection: The longest fixation event within each slot is identified, and nearby fixation events (within a reference distance) are grouped into a cluster. The reference distance is dynamically determined based on the slot size. This process is repeated iteratively, starting with the next longest fixation event that has not yet been assigned to a cluster. By the end of this iterative process, all fixation events within a slot are associated with a cluster.
- Cluster/Density Characterization: Each cluster is described using two metrics: the TFT (sum of fixation durations in the cluster) and the TFC (number of fixations in the cluster).
 Figure 2: Examples of Google SERPs with multi-slot layout. Slot categories are colour-coded (direct-top slots, directright slots, organic slots on top, and organic slots on bottom). Cursor movements are visualized as continuous black lines, while eye-tracking events are represented by filled circles (shown in black if within auxiliary slots or red if within standard slots). Circle radius is proportional to event duration.
Cluster/Density Labelling: A cluster is labelled as True if it exceeds both TFT and TFC thresholds, which are set to the median values. For categories containing multiple slots (e.g., organic-top and organic-bottom), the final label is True if at least one slot in the category meets these criteria.
Following these steps, a user is considered to fixate on a slot if their gaze remains within the limited spatial area of the slot for a minimum duration, and with enough repetitions. This heuristic ensures that only meaningful engagement with a slot is labelled as a fixation, avoiding false positives due to random or brief pauses between saccadic movements. Applying this fixation labelling method, we observe fixation rates of 42%, 46% 44% and 29% for the direct-top, direct-right, organic-top, and organic-bottom slots, respectively.
5 Deep learning models
Section titled “5 Deep learning models”5.1 Regression Task
Section titled “5.1 Regression Task”In this task, the model is trained to predict either the fixation time TFT a user spends on a specific slot or the fixation count TFC, which refers to the number of times the user focuses on that slot.
5.1.1 AdSight Model. A key challenge lies in the varying number of model outputs across trials, which is determined by the number of slots present in each SERP. To address this, we propose a Seq2Seq approach that maps a sequence of cursor movements to a corresponding sequence of predicted fixation times. We use an Encoder-Decoder Transformer, which is capable of modelling the relationships between sequences of arbitrary length. Additionally, we incorporates slot-specific features or metadata, which significantly improves the model’s performance (see Section 6).
As illustrated in Figure 3b, the process begins with the model accepting two primary inputs: (1) the mouse cursor movement data; and (2) the slot-specific metadata. These inputs are projected into a shared latent space using different embeddings, one for cursor data and another for metadata. Next, the cursor and metadata representations are fed into an Encoder-Decoder Transformer designed to capture both intra- and inter-sequence relationships. The encoder processes the sequence of cursor embeddings, while the decoder takes as input the sequence of slot metadata embeddings and the encoder’s output. Finally, the decoder’s output is passed through a shared MLP, applied to each slot in the sequence. The term “shared MLP” in Figure 3b denotes that a single instance of the MLP, with identical weights, is used to predict the TFT/TFC for all slots.
Cursor Embedding. For time series data, the embedding process involves two steps. First, a shared MLP independently projects the features of each mouse cursor position into a common latent space. This MLP consists of one hidden and an output layer, both with a number of neurons equal to the latent space size, . This initial step focuses on capturing the relationships among the features of individual cursor positions. The second step improves the latent representations of mouse cursor positions by incorporating intra-sequence relationships. We consider two different architectures for this step: (1) a bidirectional LSTM network; and (2) a Transformer encoder. For both architectures, the implementation consists of two layers, with the hidden space dimension set equal to the latent space size. For the Transformer encoder, we use two attention heads and a feed-forward network size of 512 (refer to [65] for details). The final output of the mouse cursor embedding is a sequence with a length equal to the number of cursor movements, where each element in the sequence is represented by l features.
For image data, the embedding process implements the ViT model in [23]. The entire architecture is frozen except for the last layer, which is replaced by two trainable dense layers with and l neurons, respectively, where . The final output of the cursor embedding can be seen as a sequence of only one element, the summary of the cursor trajectory, characterized by l features. Slot Metadata Embedding. This embedding relies on a shared neural network that projects each slot into a common latent space. Initially, each slot feature is independently projected into an intermediate latent space of size l. For continuous features ( and ), we use a linear layer followed by a rectified linear unit (ReLU)
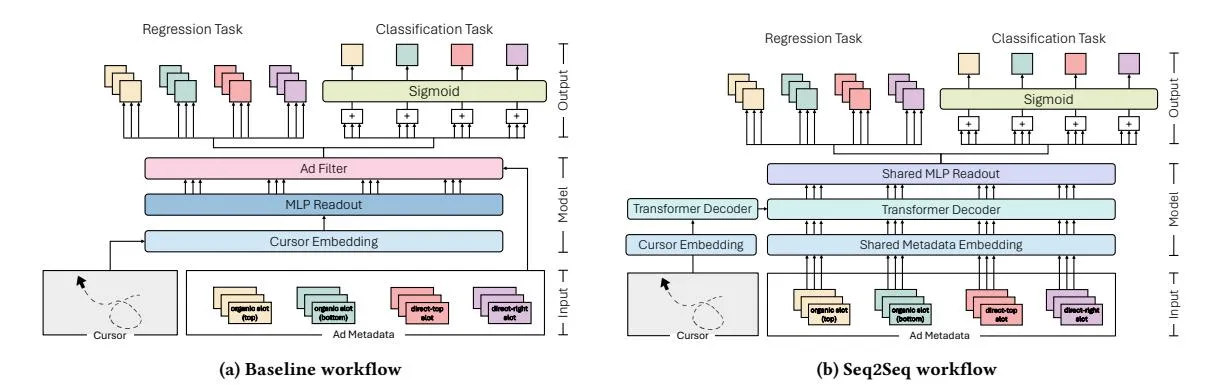
Figure 3: Comparison of the Multi-Layer Perceptron (MLP) baseline (Figure 3a) and Seq2Seq approach (Figure 3b). The baseline embeds cursor data into a dense latent space, using an MLP adapted to the maximum slots per document, with metadata-based filtering. The Seq2Seq model projects cursor data and metadata into a shared latent space, leveraging a Transformer Encoder-Decoder for sequence relationships. Regression outputs estimate quantities (TFT/TFC); classification aggregates scores by type and applies a sigmoid for probabilities.
activation function, whereas for categorical features (e.g., slot type) we use a word embedding layer.3 Next, the resulting embeddings are concatenated into a tensor and further projected into the final latent space of size l using a dense layer with ReLU activation. The output of the metadata embedding is a sequence with a length equal to the number of slots on the SERP (including auxiliary slots), where each element in the sequence is represented by l features. Encoder-Decoder Transformer. This component captures the intra- and inter-sequence relationships between the two incoming data streams. Specifically, the encoder processes the sequence of cursor embeddings, while the decoder takes as input both the sequence of slot metadata embeddings and the output of the encoder. The decoder outputs an enhanced representation of the sequence of slots. We use two encoder-decoder layers with a latent space equal to l, two attention heads and a feedforward network size of 512. Shared MLP Readout. It consists of a hidden dense layer followed by an output dense layer, with l and 1 neuron(s), respectively. Both layers utilize ReLU activation functions. The use of a ReLU activation function in the output layer is motivated by the need to predict fixation time and fixation counts, which are both non-negative quantities. Empirical tests showed that removing the ReLU activation in the output layer degrades model performance. Moreover, this MLP is shared across all elements in the slot sequence. This approach reduces the number of trainable parameters, prevents overfitting, and improves the model’s generalization capabilities. Loss Function. We explore two distinct loss functions: (1) the Mean Squared Error (MSE); and (2) the Listwise Rank Loss [15]. While MSE evaluates the error in predicting the exact fixation time/count for each slot on the page, the Listwise Rank Loss assesses how well the model’s predictions replicate the slot ranking based on true fixation time/count. Depending on the specific use case, one of these loss functions may be more suitable than the other.
For MSE, the total loss is computed as the sum of the MSE values across all slot categories, which may also include auxiliary slots. We
introduce a hyperparameter to control the contribution of the auxiliary slots to the overall loss function. When , the error from auxiliary slot predictions does not influence the model update, whereas means the error from auxiliary slots is weighted equally with the four slot categories. As shown in Section 6.1.4, incorporating provides the model with certain advantages. With respect to Listwise Rank Loss, the total loss is computed by adding the Listwise Rank Loss for the slot categories and the Listwise Rank Loss for the auxiliary slots. The contribution of the auxiliary slots is weighted by the hyperparameter . The loss functions are optimized using Adam optimizer (stochastic gradient descent with momentum) with learning rate , and decay rates and . We set a maximum number of 100 epochs, using an early stopping of 25 epochs that monitors the validation loss, and tried different batch sizes . Hyperparameter Optimisation. The total hyperparameter space consists of the latent space size (l), the hidden layer factor (k, whichapplies only to the ViT cursor embedding), the weight of the auxiliary slot loss ( ), the learning rate ( ), and the batch size (b). We optimize these hyperparameters using Bayesian optimization through the Optuna library [2], by implementing 3-fold cross-validation.
5.2 Classification Task
Section titled “5.2 Classification Task”In this task, we leverage the mouse cursor trajectories to determine whether the user has noticed a specific category of slot. Specifically, we address four binary classification problems, corresponding to the four slot categories under consideration: direct-top, direct-right, organic-top, and organic-bottom. We propose a unified model capable of producing all four binary scores simultaneously.
The proposed approach builds on the workflow described in the regression case, with an additional post-processing step applied to the outputs (see Figure 3b). As previously discussed, the workflow generates as many outputs as number of slots in a given trial. For the binary classification use case, we aggregate the outputs corresponding to the same slot category using metadata. This aggregation
A simple lookup table that stores embeddings of a fixed dictionary and size.
yields a score for each slot category including the auxiliary slots. Finally, a sigmoid activation function is applied to each score, resulting in a probability p for the user’s attention to a specific slot category. A prediction of p>0.5 indicates that the user noticed the corresponding slot category. This approach is beneficial due to the uneven distribution of slots within our dataset. For instance, since only 31% of trials contain a direct-right slot, training four separate binary models would result in the direct-right slot model being trained on just 31% of the available data. This could lead to potential overfitting and poor generalisation. Moreover, creating individual models adds computational cost and diminishes maintainability.
Loss Function. The total loss is calculated as the sum of five binary crossentropy, one for each slot category including the auxiliary slots. As in the regression case, the contribution of the auxiliary loss is weighted with a hyperparameter . Optimization is performed using the Adam optimizer with a learning rate , and decay rates and . We set a maximum number of 100 epochs, using an early stopping of 25 epochs that monitors the validation loss, and tested different batch sizes .
Hyperparameter Optimisation. The total hyperparameter space is similar with the regression use case: latent space size (l), the hidden layer factor (k, which applies only to the ViT cursor embedding), the weight of the auxiliary slot loss ( ), the learning rate ( ), and the batch size (b). Also in this case, we optimize these hyperparameters using Bayesian optimization through the Optuna library [2], by implementing 3-fold cross-validation.
5.3 Baselines
Section titled “5.3 Baselines”We perform a comparison with baseline models based on the workflow shown in Figure 3a. The main differences between the Seq2Seq workflows and the baselines are: (1) replacement of the Encoder-Decoder transformer layer with an MLP; and (2) the use of slot metadata solely for filtering the model’s output. The remainder of the workflow—cursor embedding, binary post-processing, loss functions, optimizer, and hyperparameter optimization—is identical for the Seq2Seq framework.
As indicated in Figure 3a, mouse cursor movement data are projected into a latent space using the same embeddings employed in the Seq2Seq case: LSTM, Transformer encoder, or ViT. The cursor embedding output is then flattened into a tensor of size for LSTM and the Transformer encoder, or l for ViT, where l denotes the latent space size and L represents the cursor movement sequence length. This tensor is then fed into an MLP with dense layers, each followed by a ReLU activation function. The first layer contains or l neurons, depending on the embedding used, while the hidden layers have l neurons. The output layer has 14 neurons, due to the nature of the baseline workflow. Unlike standard dense layers that produce a fixed number of outputs, our experimental datasets vary in the number of model predictions depending on the number of slots in each trial. To address this variability, the MLP’s output layer is configured to match the maximum number of slots (14) in a single trial. Consequently, the baseline workflow’s
readout MLP always generates 14 outputs, and slot metadata are subsequently applied to filter predictions corresponding to the actual slots in each document. For the classification task, the same postprocessing steps described in Section 5.2 are applied to the filtered predictions, yielding the final probability p for the user’s attention to a specific slot category.
The classification problem has been explored in prior research [6], prompting us to compare and contrast existing models. BLSTM demonstrated superior average performance for different slot types when cursor data were represented as time series. Conversely, ResNet50 performed best when cursor data were encoded as Heatmaps or Colour trajectories. Building on these insights, we include both BLSTM and ResNet50 in our experiments, using the configurations reported by Arapakis and Leiva [6]. We note that, while these models incorporate cursor embeddings similar to our proposed method, they do not utilise Seq2Seq layers. Additionally, Arapakis and Leiva [6] collected self-reported ground truth labels.
5.4 Performance Metrics
Section titled “5.4 Performance Metrics”For the regression task, we evaluate model performance using MSE and Normalized Discounted Cumulative Gain (NDCG). MSE quantifies prediction error by averaging the squared differences between predicted and actual values, while NDCG measures how well the predicted rankings align with the ground truth. For the classification task, we use Area Under the Curve (AUC) and the F1 score. AUC captures the model’s ability to distinguish between positive and negative classes by integrating true and false positive rates across thresholds. The F1 score, the harmonic mean of precision and recall, balances the correctness and completeness of positive predictions. Results represent the average predictive and ranking performance across test instances.
6 Results
Section titled “6 Results”6.1 Regression Task
Section titled “6.1 Regression Task”Table 1 compares the performance of AdSight (Seq2Seq readout) against the baselines (MLP readout) in predicting TFT and TFC across different cursor data representations and embeddings. Columns 3-4 and 7-8 present results optimised using the MSE loss function, while columns 5-6 and 9-10 display results optimized with the rank loss function. In the Embedding column, ViT, ViT-colour, and ViT-heatmap refer to the ViT embedding applied to cursor data represented as: colour trajectories, colour trajectories and slot-specific colour, and heatmap representations, respectively.
We observe that the Seq2Seq approach consistently outperforms the MLP baseline, regardless of the target (TFT or TFC), loss function (MSE or rank loss), and cursor data representation and embedding. Our findings further suggest that using a time series cursor data representation with a Transformer encoder-based cursor embedding yields the best results, irrespective of the target metric, read-out selection (Seq2Seq or MLP), or loss function. We further observe that the Seq2Seq model, utilising time series cursor data representation and Transformer encoder embeddings, is the best performing model regardless of the target metric or loss function. For example, for TFT prediction, the Seq2Seq model achieves an average MSE of 2.86, corresponding to an average error of 1.69 seconds in predicting user attention on a specific slot. Moreover,
<sup>4We also attempted to adjust the weights of the direct-top, direct-right, organic-top, and organic-bottom slot losses, considering the distribution of these categories in the dataset. However, no statistically significant improvement was observed.
| TFT | TFC | ||||||||
|---|---|---|---|---|---|---|---|---|---|
| Readout | Embedding | MSE ↓ | NDCG ↑ | Rank Loss↓ | NDCG ↑ | MSE ↓ | NDCG↑ | Rank Loss↓ | NDCG↑ |
| Transformer | 82.36 ± 0.03 | 89.51 ± 0.02 | 89.91 ± 0.03 | ||||||
| LSTM | |||||||||
| MLP | ViT | ||||||||
| ViT-colour | |||||||||
| ViT-heatmap | |||||||||
| Transformer | 2.86 ± 0.02 | 96.07 ± 0.04 | 0.1881 ± 0.0004 | 96.08 ± 0.04 | 50.07 ± 0.04 | 96.36 ± 0.05 | 0.1176 ± 0.0004 | 96.45 ± 0.05 | |
| LSTM | |||||||||
| Seq2Seq | ViT | ||||||||
| ViT-colour | |||||||||
| ViT-heatmap |
Table 1: Regression results. The first and second best results are highlighted in bold and underline format.
Table 2: Classification results. The first and second best results are highlighted in bold and underline format.
| Direc | et-Top | Direct-Right | Organ | Organic-Top | Organic-Bottom | Average Performance | ||||||
|---|---|---|---|---|---|---|---|---|---|---|---|---|
| Readout | Embedding | AUC ↑ | F1 ↑ | AUC ↑ | F1 ↑ | AUC ↑ | F1 ↑ | AUC ↑ | F1 ↑ | AUC ↑ | F1 ↑ | |
| MLP | Transformer | |||||||||||
| LSTM | ||||||||||||
| ViT | ||||||||||||
| ViT-colour | ||||||||||||
| ViT-heatmap | ||||||||||||
| Seq2Seq | Transformer | 80.79 ± 0.05 | 73.90 ± 0.07 | 81.72 ± 0.06 | 75.07 ± 0.05 | 71.87 ± 0.04 | 67.27 ± 0.06 | 82.57 ± 0.04 | 81.24 ± 0.06 | 76.25 ± 0.05 | ||
| LSTM | ||||||||||||
| ViT | ||||||||||||
| ViT-colour | 87.95 ± 0.02 | 83.11 ± 0.04 | ||||||||||
| ViT-heatmap | ||||||||||||
| BiLSTM [6] | ||||||||||||
| ResNet50 [6] | ||||||||||||
| ResNet50-colour [6] | ||||||||||||
| ResNet50-heatmap [6] |
all the visual representations of cursor data yield similar results, with ViT-colour being the approach that tends to achieve slightly better outcomes.
Considering the NDCG results, we note some interesting patterns. Specifically, regardless of the target, a model optimised using the rank loss function tends to achieve a better NDCG than a model optimized using MSE. Also, irrespective of the loss function, a model predicting TFC generally obtains better NDCG than a model predicting TFT. The Wilcoxon signed-rank test (with correction for multiple testing) revealed that models with Seq2Seq readout outperformed those with MLP readout across all target/metric/embedding combinations (p < .05). Additionally, for each target/metric, the combination of Seq2Seq readout and Transformer embedding was always statistically superior to the second-best model (p < .05).
In what follows, we examine the influence of slot metadata, cursor features, and auxiliary slots on model performance. For simplicity and brevity, we focus on the best model (Seq2Seq readout, time series cursor data representation, and Transformer cursor embedding) predicting TFT and MSE. Similar results can be observed for TFC and/or when optimizing the rank loss function.
6.1.1 Slot coordinate impact. Table 3 summarizes the impact of the slot coordinate parametrization (keeping the rest of the parameters constant) on MSE and NDCG, considering three cases: (1) normalized center, (2) extreme values
and (3) , together with width and height. As shown in the table, the normalised center coordinates yield the best results.
6.1.2~ Slot metadata impact. Table 4 summarizes the feature importance of the slot metadata, determined by the assessment of the MSE and NDCG degradation when individual features are excluded. Removing the slot type leads to the most pronounced drop in performance metrics. Moreover , we verified that the order in which slots are fed into the AdSight model does not impact the quality of the results. Specifically, we compared the mean and standard deviation obtained for the proposed order (direct-top, direct-bottom, organic-top, organic-bottom) with those from two additional random orders. The results are identical, with for MSE and for NDCG.
6.1.3 Cursor feature impact. Table 5 (top part) provides an estimation of the importance of cursor features, excluding the 2D coordinates. Feature importance is assessed by measuring the degradation
Table 3: Slots parametrization. Table 4: Slot feature anal-Best result in bold. ysis. Best results in bold.
| Slot features | MSE ↓ | NDCG↑ | ||
|---|---|---|---|---|
| Slot Met | tadata | ||
|---|---|---|---|
| type | NDCG↑ | ||
| 1 | / | 2.94 ± 0.03 | 95.89 ± 0.01 |
| / | |||
| ✓ |
in MSE and NDCG when each feature is individually removed. Notably, the normalized sequence index emerges as the most critical feature, with its removal causing the most substantial deterioration in both MSE and NDCG. Furthermore, Table 5 (bottom part), reports the results of an ablation study of cursor features. Here, we incrementally remove features in decreasing order of importance, as indicated by the first four rows (top part) of Table 5. All comparisons were statistically significant (p < .05), except for the ablation study involving the removal of the index sequence feature.
Table 5: Cursor features analysis. Best results in bold.
| Cursor F | eatures | |||||
|---|---|---|---|---|---|---|
| (x, y) | seq. index | pos. type | time | NDCG ↑ | ||
| e lice | ✓ | ✓ | ✓ | ✓ | 95.89 ± 0.01 | |
| Feature mportanc | ✓ | ✓ | ||||
| Fea | ✓ | ✓ | ||||
| I II | ✓ | ✓ | ||||
| - E | ✓ | ✓ | ✓ | ✓ | 95.89 ± 0.01 | |
| ti ci | ✓ | ✓ | ✓ | |||
| Feature Ablation | ✓ | |||||
| _ 4 | ✓ |
6.1.4 Auxiliary Slots Impact Study. To assess the contribution of auxiliary slots on model performance, we conducted two studies. In the first study, we set the hyperparameter to zero, effectively disabling the influence of auxiliary prediction errors during training. By doing so, we isolate the impact of detailed cursor position categorization on model performance by means of excluding any learning from the auxiliary loss function. We then evaluated how performance varies as the number of auxiliary slots increases from 0 to 4. The results in Table 6 indicate that the inclusion of auxiliary slots consistently enhances performance (N > 0 outperforms N = 0), with the optimal performance observed at N = 3.
In the second study, we fixed N = 3 and explored the role of the auxiliary loss function in the training process. The results, shown in Table 7, demonstrate the effect of the auxiliary loss hyperparameter . Here, corresponds to excluding the auxiliary loss function, while assigns equal weight to the auxiliary loss and the standard slot loss. Our findings suggest that assigning a moderate weight to the auxiliary loss ( ) yields the best performance.
Classification task
Section titled “Classification task”Similarly to the regression task, we evaluate AdSight (Seq2Seq readout) against baseline models (MLP readout) while varying both the
Best results in bold.
Table 6: Impact of the num- Table 7: Impact of the weight ber of auxiliary slots N. of the auxiliary loss. Best results in bold.
| N | MSE ↓ | NDCG↑ |
|---|---|---|
| 4 | ||
| 3 | ||
| 2 | ||
| 1 | ||
| 0 |
| N | α | MSE ↓ | NDCG ↑ |
|---|---|---|---|
| 3 | 0.00 | ||
| 3 | 0.33 | ||
| 3 | 0.66 | ||
| 3 | 1.00 |
cursor data representation and cursor embedding methods. In addition, we compare against baseline models [6]: BiLSTM, ResNet50, ResNet50-colour, and ResNet50-heatmap. These models use different representations: Time series, Colour trajectories, Colour trajectories and slot-specific colour, and Heatmap, respectively.
Table 2 summarises the classification results. Average Performance is calculated using weighted averages, based on the distribution of slot categories within the datasets. Specifically, the Seq2Seq approach consistently outperforms the MLP baseline across all configurations of cursor data representation and embeddings. Additionally, employing a time-series cursor data representation along with a Transformer encoder-based cursor embedding yields optimal average results, irrespective of the readout mechanism. Furthermore, the Seq2Seq model, combined with a time-series cursor data representation and Transformer encoder-based embedding, achieves the best average performance.
The models utilizing a time-series cursor data representation consistently excel in the classification tasks for direct-top and directright slot categories, while models leveraging a visual representation of cursor data demonstrate superior performance in the organic-bottom classification task. Performances on the organic-top classification task are comparable between models using time-series cursor data representation and those employing visual representations, with the former slightly outperforming the latter.
Last, the baseline models proposed by Arapakis and Leiva [6] achieve performance comparable to our baselines using MLP as the readout mechanism but fall short as compared to Seq2Seq models. The Wilcoxon signed-rank test (with correction for multiple testing) revealed that models with Seq2Seq readout consistently outperformed those with MLP readout across all slot-type/metric/embedding combinations (p < .05). For direct-top/right and organic-top slots, the combination of Seq2Seq readout and Transformer embedding was statistically superior to the second-best model (p < .05). For organic-bottom slots, models with Seq2Seq readout using visual cursor data representation performed similarly, with the best model outperforming those using time-series cursor data (p < .05). These findings demonstrate the robustness and superior accuracy of the Seq2Seq approach, particularly when paired with a time-series representation and Transformer-based embeddings.
Conclusion
Section titled “Conclusion”We introduced AdSight, a novel Transformer-based Seq2Seq model to predict user attention in multi-slot environments such as SERPs. By leveraging mouse cursor trajectories and slot-specific metadata, AdSight achieved robust performance in both regression and classification tasks, delivering an accurate quantification of user attention. Our findings highlight the importance of incorporating slot metadata and auxiliary slots. Furthermore, the Seq2Seq architecture outperformed traditional MLP-based baselines across all tested configurations, demonstrating its effectiveness in capturing complex intra- and inter-sequence relationships, and paving the way for low-cost scalable inference of user attention.
References
Section titled “References”-
[1] Johnny Accot and Shumin Zhai. 1997. Beyond Fitts’ law: models for trajectorybased HCI tasks. In Proceedings of the ACM SIGCHI Conference on Human Factors in Computing Systems (CHI ‘97).https://doi.org/10.1145/258549.258760
-
[2] Takuya Akiba, Shotaro Sano, Toshihiko Yanase, Takeru Ohta, and Masanori Koyama. 2019. Optuna: A Next-generation Hyperparameter Optimization Framework. In Proceedings of the 25th ACM SIGKDD International Conference on Knowledge Discovery & Data Mining (KDD ‘19).https://doi.org/10.1145/3292500.3330701
-
[3] Ioannis Arapakis, Mounia Lalmas, B. Barla Cambazoglu, Mari-Carmen Marcos, and Joemon M. Jose. 2014. User engagement in online News: Under the scope of sentiment, interest, affect, and gaze. Journal of the Association for Information Science and Technology 65, 10 (Oct. 2014).https://doi.org/10.1002/asi.23096
-
[4] Ioannis Arapakis, Mounia Lalmas, and George Valkanas. 2014. Understanding Within-Content Engagement through Pattern Analysis of Mouse Gestures. In Proceedings of the 23rd ACM International Conference on Conference on Information and Knowledge Management (CIKM ‘14).https://doi.org/10.1145/2661829.2661909
-
[5] Ioannis Arapakis and Luis A. Leiva. 2016. Predicting User Engagement with Direct Displays Using Mouse Cursor Information. In Proceedings of the 39th International ACM SIGIR Conference on Research and Development in Information Retrieval (SIGIR ‘16).https://doi.org/10.1145/2911451.2911505
-
[6] Ioannis Arapakis and Luis A. Leiva. 2020. Learning Efficient Representations of Mouse Movements to Predict User Attention. In Proceedings of the 43rd International ACM SIGIR Conference on Research and Development in Information Retrieval (SIGIR ‘20).https://doi.org/10.1145/3397271.3401031
-
[7] Ioannis Arapakis, Luis A. Leiva, and B. Barla Cambazoglu. 2015. Know Your Onions: Understanding the User Experience with the Knowledge Module in Web Search. In Proceedings of the 24th ACM International on Conference on Information and Knowledge Management (CIKM ‘15).https://doi.org/10.1145/2806416.2806591
-
[8] Ioannis Arapakis, Antonio Penta, Hideo Joho, and Luis A. Leiva. 2020. A Price-perattention Auction Scheme Using Mouse Cursor Information. ACM Transactions on Information Systems 38, 2, Article 13 (Jan. 2020).https://doi.org/10.1145/3374210
-
[9] Richard Atterer, Monika Wnuk, and Albrecht Schmidt. 2006. Knowing the user’s every move: user activity tracking for website usability evaluation and implicit interaction. In Proceedings of the 15th International Conference on World Wide Web (WWW ‘06).https://doi.org/10.1145/1135777.1135811
-
[10] Judith Azcarraga and Merlin Teodosia Suarez. 2012. Predicting Academic Emotions Based on Brainwaves, Mouse Behaviour and Personality Profile. In PRICAI 2012: Trends in Artificial Intelligence, Patricia Anthony, Mitsuru Ishizuka, and Dickson Lukose (Eds.).
-
[11] Panos Balatsoukas and Ian Ruthven. 2012. An eye-tracking approach to the analysis of relevance judgments on the Web: The case of Google search engine. Journal of the American Society for Information Science and Technology 63, 9 (2012), 1728–1746.https://doi.org/10.1002/asi.22707
-
[12] Paolo Boi, Gianni Fenu, Lucio Davide Spano, and Valentino Vargiu. 2016. Reconstructing User’s Attention on the Web Through Mouse Movements and Perception-Based Content Identification. ACM Transactions on Applied Perception 13, 3 (2016).https://doi.org/10.1145/2912124
-
[13] Brightfish, Profacts, and Lumen. 2018. From viewable to viewed: using eye tracking to understand the reality of attention to advertising across media. White paper. Retrieved on October 10, 2019. Available at https://effectiveviews.be/files/ White\_Paper\_From\_Viewable\_to\_viewed.pdf.
-
[14] Lukas Brückner, Ioannis Arapakis, and Luis A. Leiva. 2021. When Choice Happens: A Systematic Examination of Mouse Movement Length for Decision Making in Web Search. In Proceedings of the 44th International ACM SIGIR Conference on Research and Development in Information Retrieval. Association for Computing Machinery, New York, NY, USA.https://doi.org/10.1145/3404835.3463055
-
[15] Zhe Cao, Tao Qin, Tie-Yan Liu, Ming-Feng Tsai, and Hang Li. 2007. Learning to rank: from pairwise approach to listwise approach. In Proceedings of the 24th International Conference on Machine Learning (ICML ‘07). https://doi.org/10.1145/ 1273496.1273513
-
[16] S. K. Card, W. K. English, and B. J. Burr. 1987. Evaluation of Mouse, Rate-controlled Isometric Joystick, Step Keys, and Text Keys, for Text Selection on a CRT. In Human-computer Interaction, R. M. Baecker and W. A. S. Buxton (Eds.).
-
[17] Souradeep Chakraborty, Zijun Wei, Conor Kelton, Seoyoung Ahn, Aruna Balasubramanian, Gregory J. Zelinsky, and Dimitris Samaras. 2023. Predicting Visual Attention in Graphic Design Documents. IEEE Transactions on Multimedia 25 (2023).https://doi.org/10.1109/tmm.2022.3176942
-
[18] Mon Chu Chen, John R. Anderson, and Myeong Ho Sohn. 2001. What can a mouse cursor tell us more? correlation of eye/mouse movements on web browsing. In CHI ‘01 Extended Abstracts on Human Factors in Computing Systems (CHI EA ‘01). https://doi.org/10.1145/634067.634234
-
[19] Aleksandr Chuklin and Maarten de Rijke. 2016. Incorporating Clicks, Attention and Satisfaction into a Search Engine Result Page Evaluation Model. In Proceedings of the 25th ACM International on Conference on Information and Knowledge Management (CIKM ‘16).https://doi.org/10.1145/2983323.2983829
-
[20] Mark Claypool, Phong Le, Makoto Wased, and David Brown. 2001. Implicit interest indicators. In Proceedings of the 6th International Conference on Intelligent
-
User Interfaces (IUI ‘01).https://doi.org/10.1145/359784.359836
-
[21] Fernando Diaz, Ryen White, Georg Buscher, and Dan Liebling. 2013. Robust models of mouse movement on dynamic web search results pages. In Proceedings of the 22nd ACM International Conference on Information & Knowledge Management (CIKM ‘13).https://doi.org/10.1145/2505515.2505717
-
[22] Abdigani Diriye, Ryen White, Georg Buscher, and Susan Dumais. 2012. Leaving So Soon? Understanding and Predicting Web Search Abandonment Rationales. In Proceedings of the 21st ACM International Conference on Information and Knowledge Management (CIKM ‘12).https://doi.org/10.1145/2396761.2398399
-
[23] Alexey Dosovitskiy, Lucas Beyer, Alexander Kolesnikov, Dirk Weissenborn, Xiaohua Zhai, Thomas Unterthiner, Mostafa Dehghani, Matthias Minderer, Georg Heigold, Sylvain Gelly, Jakob Uszkoreit, and Neil Houlsby. 2021. An Image is Worth 16x16 Words: Transformers for Image Recognition at Scale. In International Conference on Learning Representations.
-
[24] Henry A. Feild, James Allan, and Rosie Jones. 2010. Predicting searcher frustration. In Proceedings of the 33rd International ACM SIGIR Conference on Research and Development in Information Retrieval (SIGIR ‘10). https://doi.org/10.1145/1835449. 1835458
-
[25] Jeffrey Gleason, Alice Koeninger, Desheng Hu, Jessica Teurn, Yakov Bart, Samsun Knight, Ronald E. Robertson, and Christo Wilson. 2024. Search Engine Revenue from Navigational and Brand Advertising. In Proceedings of the Eighteenth International AAAI Conference on Web and Social Media, Vol. 18. https: //doi.org/10.1609/icwsm.v18i1.31329
-
[26] Joseph H. Goldberg, Mark J. Stimson, Marion Lewenstein, Neil Scott, and Anna M. Wichansky. 2002. Eye tracking in web search tasks: design implications. In Proceedings of the 2002 Symposium on Eye Tracking Research & Applications (ETRA ‘02).https://doi.org/10.1145/507072.507082
-
[27] Qi Guo and Eugene Agichtein. 2008. Exploring mouse movements for inferring query intent. In Proceedings of the 31st Annual International ACM SIGIR Conference on Research and Development in Information Retrieval (SIGIR ‘08). https://doi.org/ 10.1145/1390334.1390462
-
[28] Qi Guo and Eugene Agichtein. 2010. Ready to buy or just browsing? detecting web searcher goals from interaction data. In Proceedings of the 33rd International ACM SIGIR Conference on Research and Development in Information Retrieval (SIGIR ‘10).https://doi.org/10.1145/1835449.1835473
-
[29] Qi Guo and Eugene Agichtein. 2012. Beyond dwell time: estimating document relevance from cursor movements and other post-click searcher behavior. In Proceedings of the 21st International Conference on World Wide Web (WWW ‘12). https://doi.org/10.1145/2187836.2187914
-
[30] Qi Guo, Dmitry Lagun, and Eugene Agichtein. 2012. Predicting web search success with fine-grained interaction data. In Proceedings of the 21st ACM International Conference on Information and Knowledge Management (CIKM ‘12). https://doi.org/10.1145/2396761.2398570
-
[31] Qi Guo, Shuai Yuan, and Eugene Agichtein. 2011. Detecting success in mobile search from interaction. In Proceedings of the 34th International ACM SIGIR Conference on Research and Development in Information Retrieval (SIGIR ‘11). https://doi.org/10.1145/2009916.2010133
-
[32] Jacek Gwizdka, Rachel Tessmer, Yao-Cheng Chan, Kavita Radhakrishnan, and Maya L. Henry. 2022. Eye-Gaze and Mouse-Movements on Web Search as Indicators of Cognitive Impairment. In Information Systems and Neuroscience. https://doi.org/10.1007/978-3-031-13064-9\_20 LNISO.
-
[33] Ahmed Hassan, Rosie Jones, and Kristina Lisa Klinkner. 2010. Beyond DCG: user behavior as a predictor of a successful search. In Proceedings of the Third ACM International Conference on Web Search and Data Mining (WSDM ‘10). https: //doi.org/10.1145/1718487.1718515
-
[34] David Hauger, Alexandros Paramythis, and Stephan Weibelzahl. 2011. Using browser interaction data to determine page reading behavior. In Proceedings of the 19th International Conference on User Modeling, Adaption, and Personalization (UMAP’11).
-
[35] Jeff Huang, Ryen White, and Georg Buscher. 2012. User see, user point: gaze and cursor alignment in web search. In Proceedings of the SIGCHI Conference on Human Factors in Computing Systems (CHI ‘12).https://doi.org/10.1145/2207676.2208591
-
[36] Jeff Huang, Ryen W. White, Georg Buscher, and Kuansan Wang. 2012. Improving searcher models using mouse cursor activity. In Proceedings of the 35th International ACM SIGIR Conference on Research and Development in Information Retrieval (SIGIR ‘12).https://doi.org/10.1145/2348283.2348313
-
[37] Jeff Huang, Ryen W. White, and Susan Dumais. 2011. No clicks, no problem: using cursor movements to understand and improve search. In Proceedings of the SIGCHI Conference on Human Factors in Computing Systems (CHI ‘11). https: //doi.org/10.1145/1978942.1979125
-
[38] Amit Kumar Jaiswal, Prayag Tiwari, and M. Shamim Hossain. 2023. Predicting users’ behavior using mouse movement information: an information foraging theory perspective. Neural Computing and Applications 35, 33 (2023). https: //doi.org/10.1007/s00521-020-05306-7
-
[39] Arturas Kaklauskas, Mindaugas Krutinis, and Mark Seniut. 2009. Biometric Mouse Intelligent System for Student’s Emotional and Examination Process Analysis. In 2009 Ninth IEEE International Conference on Advanced Learning Technologies. https://doi.org/10.1109/ICALT.2009.130
-
[40] Ashish Kapoor, Winslow Burleson, and Rosalind W. Picard. 2007. Automatic prediction of frustration. International Journal of Human-Computer Studies 65, 8 (2007).https://doi.org/10.1016/j.ijhcs.2007.02.003
-
[41] Peter Kratky and Daniela Chuda. 2016. Estimating Gender and Age of Web Page Visitors from the Way They Use Their Mouse. In Proceedings of the 25th International Conference Companion on World Wide Web (WWW ‘16 Companion). https://doi.org/10.1145/2872518.2889384
-
[42] Dmitry Lagun, Mikhail Ageev, Qi Guo, and Eugene Agichtein. 2014. Discovering common motifs in cursor movement data for improving web search. In Proceedings of the 7th ACM International Conference on Web Search and Data Mining (WSDM ‘14).https://doi.org/10.1145/2556195.2556265
-
[43] Kayhan Latifzadeh, Jacek Gwizdka, and Luis A. Leiva. 2025. A Versatile Dataset of Mouse and Eye Movements on Search Engine Results Pages. In Proceedings of the 48th International ACM SIGIR Conference on Research and Development in Information Retrieval.https://doi.org/10.1145/3726302.3730325
-
[44] Luis A Leiva and Ioannis Arapakis. 2020. The Attentive Cursor Dataset. Frontiers in Human Neuroscience 14 (2020).https://doi.org/10.3389/fnhum.2020.565664
-
[45] Luis A. Leiva, Ioannis Arapakis, and Costas Iordanou. 2021. My Mouse, My Rules: Privacy Issues of Behavioral User Profiling via Mouse Tracking. In Proceedings of the 2021 Conference on Human Information Interaction and Retrieval (CHIIR ‘21). https://doi.org/10.1145/3406522.3446011
-
[46] Luis A. Leiva and Roberto Vivó. 2013. Web browsing behavior analysis and interactive hypervideo. ACM Transactions on the Web 7, 4 (2013). https://doi.org/ 10.1145/2529995.2529996
-
[47] Yixuan Li, Pingmei Xu, Dmitry Lagun, and Vidhya Navalpakkam. 2017. Towards Measuring and Inferring User Interest from Gaze. In Proceedings of the 26th International Conference on World Wide Web Companion (WWW ‘17 Companion). https://doi.org/10.1145/3041021.3054182
-
[48] Yiqun Liu, Ye Chen, Jinhui Tang, Jiashen Sun, Min Zhang, Shaoping Ma, and Xuan Zhu. 2015. Different Users, Different Opinions: Predicting Search Satisfaction with Mouse Movement Information. In Proceedings of the 38th International ACM SIGIR Conference on Research and Development in Information Retrieval (SIGIR ‘15).https://doi.org/10.1145/2766462.2767721
-
[49] Yiqun Liu, Zeyang Liu, Ke Zhou, Meng Wang, Huanbo Luan, Chao Wang, Min Zhang, and Shaoping Ma. 2016. Predicting Search User Examination with Visual Saliency. In Proceedings of the 39th International ACM SIGIR Conference on Research and Development in Information Retrieval (SIGIR ‘16). https://doi.org/10.1145/ 2911451.2911517
-
[50] Yiqun Liu, Chao Wang, Ke Zhou, Jianyun Nie, Min Zhang, and Shaoping Ma. 2014. From Skimming to Reading: A Two-stage Examination Model for Web Search. In Proceedings of the 23rd ACM International Conference on Conference on Information and Knowledge Management (CIKM ‘14).https://doi.org/10.1145/2661829.2661907
-
[51] Mora Maldonado, Ewan Dunbar, and Emmanuel Chemla. 2019. Mouse tracking as a window into decision making. Behavior Research Methods 51, 3 (2019). https://doi.org/10.3758/s13428-018-01194-x
-
[52] Josip Maras. 2016. Secrets of the JavaScript Ninja.
-
[53] Daniel Martín-Albo, Luis A. Leiva, Jeff Huang, and Réjean Plamondon. 2016. Strokes of insight: User intent detection and kinematic compression of mouse cursor trails. Information Processing & Management 52, 6 (2016). https://doi.org/ 10.1016/j.ipm.2016.04.005
-
[54] Julian McAuley, Christopher Targett, Qinfeng Shi, and Anton van den Hengel. 2015. Image-Based Recommendations on Styles and Substitutes. In Proceedings of the 38th International ACM SIGIR Conference on Research and Development in Information Retrieval.https://doi.org/10.1145/2766462.2767755
-
[55] Florian Mueller and Andrea Lockerd. 2001. Cheese: tracking mouse movement activity on websites, a tool for user modeling. In CHI ‘01 Extended Abstracts on Human Factors in Computing Systems (CHI EA ‘01). https://doi.org/10.1145/ 634067.634233
-
[56] Alexandra Papoutsaki, Patsorn Sangkloy, James Laskey, Nediyana Daskalova, Jeff Huang, and James Hays. 2016. Webgazer: scalable webcam eye tracking using user interactions. In Proceedings of the Twenty-Fifth International Joint Conference on Artificial Intelligence (IJCAI’16).
-
[57] Avar Pentel. 2017. Predicting Age and Gender by Keystroke Dynamics and Mouse Patterns. In Adjunct Publication of the 25th Conference on User Modeling, Adaptation and Personalization (UMAP ‘17). https://doi.org/10.1145/3099023. 3099105
-
[58] Nirmal Roy, David Maxwell, and Claudia Hauff. 2022. Users and Contemporary SERPs: A (Re-)Investigation. In Proceedings of the 45th International ACM SIGIR Conference on Research and Development in Information Retrieval (SIGIR ‘22). https://doi.org/10.1145/3477495.3531719
-
[59] Yunqiu Shao, Jiaxin Mao, Yiqun Liu, Min Zhang, and Shaoping Ma. 2022. From linear to non-linear: investigating the effects of right-rail results on complex SERPs. Advances in Computational Intelligence 2, 1 (2022). https://doi.org/10. 1007/s43674-021-00028-2
-
[60] Bracha Shapira, Meirav Taieb-Maimon, and Anny Moskowitz. 2006. Study of the usefulness of known and new implicit indicators and their optimal combination for accurate inference of users interests. In Proceedings of the 2006 ACM Symposium on Applied Computing (SAC ‘06).https://doi.org/10.1145/1141277.1141542
-
[61] Michael W. Smith, Joseph Sharit, and Sara J. Czaja. 1999. Aging, Motor Control, and the Performance of Computer Mouse Tasks. Human Factors 41, 3 (1999). https://doi.org/10.1518/001872099779611102
-
[62] D. Soman. 1998. The illusion of delayed incentives: Evaluating future effortmoney transactions. Journal of Marketing Research 35, 4 (1998). https://doi.org/ 10.1177/002224379803500402
-
[63] Maximilian Speicher, Andreas Both, and Martin Gaedke. 2013. TellMyRelevance! predicting the relevance of web search results from cursor interactions. In Proceedings of the 22nd ACM International Conference on Information & Knowledge Management (CIKM ‘13).https://doi.org/10.1145/2505515.2505703
-
[64] Paul E. Stillman, Xi Shen, and Melissa J. Ferguson. 2018. How Mouse-tracking Can Advance Social Cognitive Theory. Trends in Cognitive Sciences 22, 6 (2018). https://doi.org/10.1016/j.tics.2018.03.012
-
[65] Ashish Vaswani, Noam Shazeer, Niki Parmar, Jakob Uszkoreit, Llion Jones, Aidan N Gomez, Ł ukasz Kaiser, and Illia Polosukhin. 2017. Attention is All you Need. In Advances in Neural Information Processing Systems, Vol. 30. Curran Associates, Inc. https://proceedings.neurips.cc/paper\_files/paper/2017/file/ 3f5ee243547dee91fbd053c1c4a845aa-Paper.pdf
-
[66] Takashi Yamauchi. 2013. Mouse Trajectories and State Anxiety: Feature Selection with Random Forest. In 2013 Humaine Association Conference on Affective Computing and Intelligent Interaction.https://doi.org/10.1109/ACII.2013.72
-
[67] Takashi Yamauchi and Casady Bowman. 2014. Mining Cursor Motions to Find the Gender, Experience, and Feelings of Computer Users. In 2014 IEEE International Conference on Data Mining Workshop.https://doi.org/10.1109/ICDMW.2014.131
-
[68] Gal Zauberman. 2003. The intertemporal dynamics of consumer lock-in. Journal of Consumer Research 30 (2003).
-
[69] Ines Zelch, Matthias Hagen, and Martin Potthast. 2024. A User Study on the Acceptance of Native Advertising in Generative IR. In Proceedings of the 2024 Conference on Human Information Interaction and Retrieval (CHIIR ‘24). https: //doi.org/10.1145/3627508.3638316
-
[70] Philippe Zimmermann, Sissel Guttormsen, Brigitta Danuser, and Patrick Gomez and. 2003. Affective Computing–A Rationale for Measuring Mood With Mouse and Keyboard. International Journal of Occupational Safety and Ergonomics 9, 4 (2003).https://doi.org/10.1080/10803548.2003.11076589
Received 20 February 2024; revised 12 March 2025; accepted 5 June 2025