Bayesian Network Based Modeling Of Consumer Behavioral Decision Making
ABSTRACT
Section titled “ABSTRACT”In order to more comprehensively study the influencing role mechanism of consumer behavioral decision-making process in the digital economy platform and explore the influencing factors of consumer behavioral decision-making, this paper constructs a model of consumer behavioral decision-making process based on Bayesian network. With the help of Netica software to construct the Bayesian network topology, using EM algorithm to learn the parameters of the Bayesian network model, and proposed to use the Bayesian network to carry out sensitivity analysis and probabilistic inference, and formulate the corresponding Bayesian network model framework. Subsequently, the influencing factors of channel search willingness and purchase willingness and their relationships in the consumer behavioral decision-making process in the digital economy platform environment are analyzed. The structural equation model is introduced, the measurement equation and structural subequation calculation methods are determined, and the sample data are collected by means of questionnaires to carry out the test and analysis of the model of consumer behavioral decision-making process. The CR value of each variable in the model of this paper is higher than 0.7, and the AVE values are all greater than 0.5, and the model performs well in terms of intrinsic quality. The exogenous latent variables such as perceived benefits, channel trust, and transfer costs have a significant positive effect relationship on the endogenous latent variables such as search behavior and purchase intention (P<0.05).
Keywords: bayesian networks, em algorithm, structural equation modeling, consumer behavioral decision making
1. Introduction
Section titled “1. Introduction”With the continuous development of science and technology, the digital economy has become an important driving force for global economic development [1]. The digital economy has changed the traditional economic model through the application of information technology and the Internet, bringing unprecedented convenience and choice to consumers [2]. In this digital era, consumers can consume through Internet shopping, online payment, and e-commerce, and the market for digital products and services is getting bigger and bigger, and the behavioral decisions of consumers have changed significantly.
In the traditional economy, consumers obtain information about goods through media advertisements or recommendations from friends, incurring significant time and space costs. And through the digital economy, consumers can obtain information about products and services anytime and anywhere through search engines, social media and other channels, and consumers can make more rational and informed purchase decisions by comparing information such as prices, user reviews and product characteristics [3-4]. The transparency and timeliness of information enables consumers to make better decisions for their needs, improving the efficiency and quality of shopping. Through the digital economy, consumers can shop at home, in the office, or anywhere through e-commerce platforms, saving time and energy, and consumers do not need to wait in line to pay, but only need a few clicks to complete the payment, which greatly improves the convenience and efficiency of shopping [5-6].
However, the digital economy has also brought some challenges and implications for consumer behavioral decision-making. First, the development of the digital economy has exacerbated the problem of consumer information overload, and consumers need to spend more time and energy screening and comparing information about different goods to avoid being misled by low-quality or fraudulent products [7]. In addition, there is also the problem of false propaganda and illegible information in the digital economy, which reduces the sense of shopping experience, and consumers need to have a certain degree of media literacy and judgment to identify the authenticity [8-9]. In the future, with the further development of science and technology, consumer behavioral decision-making in the era of digital economy will continue to change. Moreover, the consumer behavioral decisionmaking process is also under constant change with the intervention of multiple factors, such as family members, social media, lifestyle, social culture, and experience habits [10-14]. Therefore, incorporating the study of consumer behavioral decision-making process into strategic planning and paying close attention to the industry development trend will be an important factor for enterprises to win the competitive advantage [15].
Consumers will go through multiple steps when purchasing the final product, but not every consumer has the same steps. Considering different consumer purchasing behaviors, product services, and current marketing strategies, a consumer behavior decision model is constructed to obtain the correlations and weights of the major factors affecting the final decision in the decision-making process, which provides a new direction for the improvement of the marketing strategies of merchants on major digital economy platforms. Literature [16] analyzed the evolution of consumer decisionmaking patterns in digital markets with a designed structural hierarchical model, used the fuzzy Delphi method to obtain the influencing factors of the evolution, and calculated the weights of these factors through the fuzzy hierarchical analysis method. Literature [17] identified the decision-making process of consumer buying behavior by modeling and analyzed the decision-making differences between consumer prototypes, locating that decision-making styles and product understanding influenced the decision-making process. Literature [18] updated the model under the influence of online features of O2O (Online to Offline) websites considering word-of-mouth and discount promotions in the consumer purchase decision model, and by analyzing the website data, identified the perceived risk and the intrinsic linkage of online factors affecting the consumer purchase decision.
Further, literature [19] conducted an in-depth study of the online purchase decision process and utilized an integrated technology acceptance model to develop a retention consumer behavior assessment model under the consideration of two purchase factors, namely trust and quality, as a means to help platform merchants improve their marketing direction. Literature [20] designed a multi-intelligence body simulation model supported by overreaction theory for the change of group decision-making process with irrational color in green consumption behavior, revealing that the widening consumption gap between green and general, high economic profit and government encouragement promote the evolution of group decision-making behavior. Literature [21] synthesized the consumer decision theory, disposal decision classification system, and commodity disposal behavior factors to create a model of the decision-making process of consumers’ behavior in disposing of commodities, which values the surplus value of commodities.
In this paper, Bayesian network is used to study the modeling of consumer behavioral decisionmaking process and explore the influencing factors of consumer behavioral decision-making process. A three-layer (initial node layer, associated node layer and target layer) Bayesian network topology is constructed by Netica software, and the conditional probability table of the three-layer Bayesian network model is learned by using EM algorithm. The known Bayesian network model is used for sensitive analysis in order to obtain the key factors affecting the consumer behavioral decision-making process, and causal and diagnostic reasoning is carried out on consumer behavioral decisions through Bayesian inference rules to materialize the consumer behavioral decisions into concrete data. The structural equation model is used as a testing tool for the model of consumer behavioral decisionmaking process in this paper, and the calculation methods of measurement equation and structural equation are formulated. Relying on the structural equation model, the consumer behavior decisionmaking model in this paper is respectively subjected to validation factor analysis to verify the scientific rationality of the model in terms of model fitting and significance. Finally, on the basis of this paper’s model, the optimization path of marketing strategy of digital economy platform is proposed to formulate precise and personalized marketing strategy for consumer behavioral decision-making and provide assistance for enterprise development.
2. A decision-making process model of consumer behavior based on Bayesian networks
Section titled “2. A decision-making process model of consumer behavior based on Bayesian networks”With the rapid development of the digital economy platform, it enhances the shopping experience of consumers and promotes the diversification of consumer consumption patterns and behavioral decisions. On this basis, this paper introduces Bayesian network, constructs a model of consumer behavioral decision-making process, uses Bayesian network to explore consumer behavioral decisionmaking process and key factors affecting consumer behavioral decision-making process, and aims to provide theoretical support for the managers of digital platforms to fully understand consumer behavioral decision-making process.
2.1. Principles of Bayesian networks
Section titled “2.1. Principles of Bayesian networks”Bayesian networks, also known as Bayesian belief networks or credence networks, are graphical models used to represent and handle probabilistic dependencies between variables [22]. This model enables efficient management and inference of complex probability distributions through directed acyclic graphs (DAGs) combined with probabilistic principles. Bayesian networks are extremely advantageous in representing dependencies between variables as well as probability distributions. Bayesian networks consist of two main parts: first, a directed acyclic graph, Bayesian networks are based on a directed acyclic graph, in which each node represents a random variable, which can be observations, latent variables, or hypotheses. Edges in the graph represent dependencies between variables, specifically, edges pointing from one node to another node indicate that the former is the
cause of the latter; secondly, the conditional probability table (CPT), where each node has a conditional probability table describing the probability distribution of the state of that node given the state of its parent node. For a node without a parent, the CPT describes the prior probability of that node.
The Bayesian network model construction process is as follows:
The first step is to define the network nodes. The influencing factors of the research object are identified and defined as network nodes, and the node state of each network node is determined.
The second is to construct the Bayesian network topology, according to the dependency relationship between nodes, connect each node with a directed arc to complete the Bayesian network topology construction.
The last is to obtain the conditional probability. The conditional probability distribution is derived through the parameter relationship between the nodes at each level. For any set of variables in the Bayesian network, their joint probability distribution can be expressed as:
(1)
Here, denotes the set of parent nodes of variable in the network. The computation of joint probability distributions for Bayesian networks relies on a conditional probability table for each node. The structure of the network allows us to systematically compute the probability of any particular combination of variables. For example, if there are three variables A, B, C in the network, where A is the root node and B and C are children of A, then the joint probability distribution .
The following probability formulas are commonly used in Bayesian networks:
- Conditional Probability. If A and B are two events where P(B) > 0, then the probability of event A occurring conditional on event B occurring is defined as:
P(A \mid B) = \frac{P(A \cap B)}{P(B)} \tag{2}
- Multiplication formula. If A and B are two events, then the probability of A and B occurring at the same time, i.e. their joint probability , can be expressed by the multiplication formula as:
(3)
- Full probability formula. The full probability formula is used to calculate the total probability of an event by summing the weighted probabilities of that event under different conditions. If event B can be caused by a set of mutually exclusive events , then:
(4)
- Bayesian formula. The Bayes formula describes how to update probabilistic judgments about events when certain information is known. Specifically, for two events A and B, where P(B) > 0 and all possible scenarios of A are known, Bayes’ theorem can be stated as follows
(5)
- Chain rule. For variable , their joint probability distribution can be expressed using the chain rule as:
(6)
2.2. A Bayesian network model framework for consumer behavioral decision-making
Section titled “2.2. A Bayesian network model framework for consumer behavioral decision-making”From the point of view of probability and statistics, each influencing factor of consumer’s behavioral decision-making is a random event, which means that if you ignore the influence of other factors, each factor may occur independently and randomly, but in fact, due to the extreme complexity of the consumer’s behavioral choice mechanism, which makes the various factors interact with each other, rather than independently occurring randomly. Bayesian network model is based on the idea of Bayesian statistics, which can well simulate the causal relationship between random variables, and reasoning about the indicators to find out the changes between the factors, so this chapter chooses the Bayesian network model to study the consumer behavior decision-making process of this complex system.
- 2.2.1. Topology of consumer behavioral decision-making process. Constructing the topology of Bayesian networks is the foundation of Bayesian network modeling. Combining the advantages of algorithm-based network topology learning methods and expert knowledge-based topology construction, this paper will first use the scoring-based structure learning algorithm built in the Bayesian network model analysis software Netica to initially learn the network topology, and then adjust the correlation relationship between nodes and the pointing of the edges of the network topology according to the mechanism of the consumer’s online shopping behavior, so that the final constructed Bayesian network topology.
- 2.2.2. Consumer Behavioral Decision Making Bayesian Network Parameter Learning. After the Bayesian network directed acyclic graph topology is determined, the conditional probability table (CPT) between each node of the model needs to be determined based on the sample data and prior information to measure the size of the relationship between each node and its parent node, i.e., the parameter learning of the Bayesian model. In this paper, the prior probabilities of each node are assumed to be equal, and the EM algorithm is used to learn the sample data and obtain the conditional probability tables of the nodes [23].Netica software integrates the EM algorithm for model parameter learning, and based on the determined network topology, the conditional probability tables of the Bayesian network model are learned using Netica software. The state (rank) of each node in the network graph corresponds to the discretization result, and the parameter learning gives the conditional probability table to the Bayesian network, and the numbers and bars of each node indicate the probability of the state of the node occurring if the state of the other nodes is unknown, which is called the initial state of the Bayesian network model.
- 2.2.3. Bayesian Network Reasoning for Consumer Behavioral Decision Making. This section utilizes known Bayesian network models for sensitivity analysis and probabilistic inference. Sensitivity analysis refers to the degree of sensitivity of changes in the probability of individual nodes in a Bayesian network to changes in the probability of the target node, expressed in terms of the entropy and variance of the target variable in the corresponding state. The entropy of the target variable X is:
H(X) = -\sum_{x \in X} P(x) \log(x) \tag{7}
The variance is:
(8)
Where is the mean value, i.e:
\mu = \sum_{x \in X} x P(x) \tag{9}
(10)
Probabilistic reasoning refers to the process of using Bayesian networks to solve practical problems, that is, in the case of a given Bayesian network model, according to the probability distribution of the known nodes to calculate the conditional probability distribution of the target node, so as to infer the likelihood of the size of the occurrence of the target event, which mainly includes causal reasoning and diagnostic reasoning. Causal reasoning refers to the known cause, reasoning the probability that the cause leads to the occurrence of the result; diagnostic reasoning refers to the known result, reasoning the cause and probability of the occurrence of the result.
-
2.3. Bayesian Network Model Analysis of Consumer Behavioral Decision Making
-
2.3.1. Factors Influencing Consumer Behavioral Decisions. Consumer behavior decision-making process is influenced by many factors. Consumers’ thinking of utility maximization in the digital economy platform environment makes consumers alternately use multiple channels online and offline to complete the process of consumer behavioral decision-making, but there are transfer costs for interchannel switching. This study tries to link channel perceived benefits, channel transfer costs, channel trust with consumers’ online search willingness and purchase willingness, and to identify the factors that influence the consumer behavioral decision-making process by combining customer value theory and trust theory.
-
- Willingness to search. Search is an important part of the consumer shopping stage, the more information consumers have about the product, the more likely they are to make a satisfactory purchase decision, but their willingness to search for information is limited by the cost of channel search. This leads to the hypothesis that.
- H1(a):Channel search willingness and purchase intention are positively influenced relationship.
- H1(b): Purchase intention can have a reverse effect on channel search intention.
-
- Perceived benefits. Consumers are often unable to experience the utility of a product when they are shopping, and make their shopping decisions by evaluating the benefits of the shopping channel. The greater the perceived benefit, the more attractive it is to consumers, and the perceived benefit is the most important factor in determining the intention to buy. The resulting hypothesis.
-
H2(a):Consumer channel perceived benefits and online search intention is a positive influence relationship.
- H2(b):Consumer search intention can have a reverse effect on perceived benefits.
- H3(a):Consumer channel perceived benefits and online purchase intention are positively influenced.
- H3(b):Purchase intention can have an inverse effect on channel trust.
-
- Channel trust. Consumers will have more trust in the channel because of the reliability of the digital economy platform channel and the high quality of information provided by the channel, and trust will increase consumers’ favorability towards the company and reduce their perceived risk. It is hypothesized that.
- H4(a): Channel trust and online search intention are positively influenced relationship.
- H4(b):Search willingness can have an inverse effect on channel trust.
- H5(a):Channel trust and online purchase intention are positively influenced.
- H5(b):Willingness to buy can have an inverse effect on channel trust.
-
- Transfer cost. In this paper, the transfer cost is set as the perceived cost incurred by consumers to transfer from the online channel to the ofϐline channel of the digital economy platform, thus hypothesizing that.
- H6(a):Transfer cost and online search willingness is a positive influence relationship.
- H6(b):Search willingness can have an inverse effect on transfer cost.
- H7(a):Transfer cost is a positive influence relationship on online purchase intention.
- H7(b):Willingness to buy can have an inverse effect on transfer costs.
-
2.3.2. Bayesian network construction. K-means clustering analysis was performed on each latent variable score using SPSS 23.0, and in order to reduce the complexity of the operation and increase the recognizability of the judgment results, this paper clustered each latent variable into high, medium, and low states. This study veriϐies the differences of latent variables in each dimension through SPSS ANOVA to further verify the signiϐicance of categorization on dimension scores, and the speciϐic results are shown in Table 1. The ANOVA results indicate that the mean square values of the dimensions are highly variable and all show signiϐicance in the dimension scores (P<0.05). The ANOVA results indicate that it is reasonable to divide the sample data clustering into high, medium and low dimensions.
-
Clustering Error F Significance Mean square Degree of freedom Mean square Degree of freedom Perceived benefits 4.788 2 0.149 516 32.688 0.000 Channel trust 27.851 2 0.247 516 117.392 0.000 Search intention 43.837 2 0.251 516 178.552 0.000 Transfer cost 19.641 2 0.404 516 48.009 0.000 Purchase intention 9.437 2 0.143 516 67.263 0.000
Table 1. Latent variable
In this paper, we use SPSS modeler18.0 to construct a TAN Bayesian network using the maximum likelihood method on the clustered data, as shown in Figure 1. From the structure of the constructed Bayesian network, it can be seen that the willingness to buy is the parent node of transfer cost, perceived benefit, search willingness and channel trust, indicating that the willingness to buy is affected by these four latent variables, in addition, the online search willingness is the parent node of the transfer cost, perceived benefit and channel trust, indicating that the online search willingness is also affected by these three variables, and the effect of online search willingness on the online purchase willingness not only depends on itself, but is also influenced by perceived benefits of online purchase, channel trust and channel transfer cost.
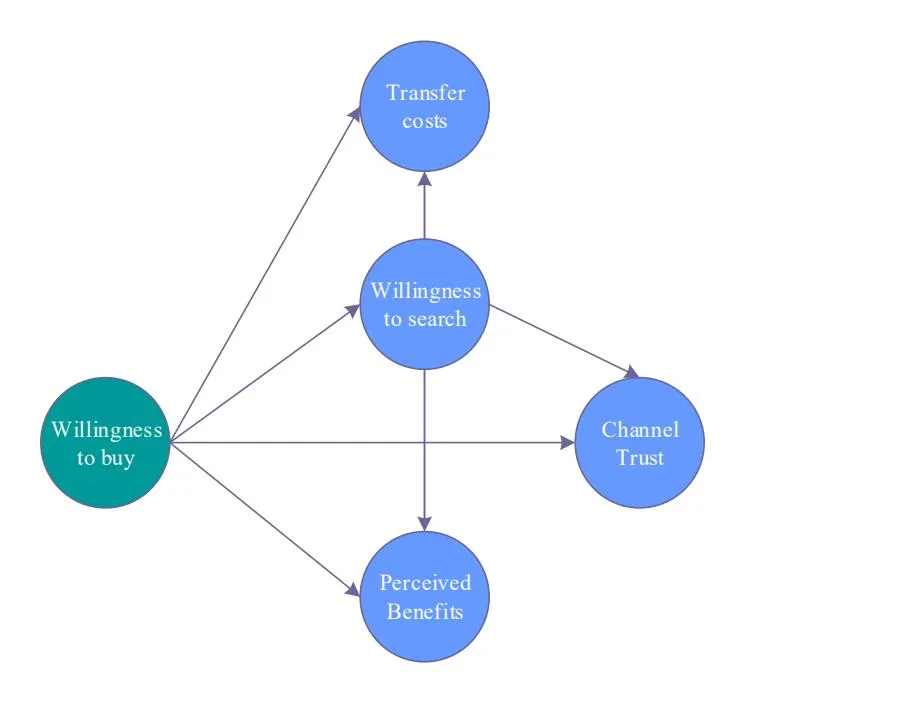
Fig. 1. Bayesian Network of Consumer Behavior Decision Process
2.3.3. Bayesian network prediction. Based on the constructed Bayesian network, the predictions of transfer cost, channel trust and perceived beneϐit on search willingness and purchase willingness in different states can be obtained.
The Bayesian inference table of transfer cost in different states is shown in Table 2. Due to the feature of low search cost of online channel in digital economy platform, consumers tend to search product information through online after generating shopping demand. From the table, it can be seen that the higher the perceived cost generated by transferring online search to offline purchase, the stronger the consumers’ willingness to choose online purchase, indicating that the transfer cost has a certain positive effect on the locking of online channels.
| Searching intention | Purchase intention | |||||
|---|---|---|---|---|---|---|
| State | High | Middle | Low | High | Middle | Low |
| High | 0.57 | 0.384 | 0.041 | 0.449 | 0.482 | 0.05 |
| Middle | 0.46 | 0.427 | 0.102 | 0.236 | 0.542 | 0.209 |
| Low | 0.251 | 0.544 | 0.201 | 0.151 | 0.469 | 0.363 |
Table 2. Bayesian inference diagram of transfer cost
The Bayesian inference table for channel trust in different states is shown in Table 3. As channel trust changes along the high-moderate-low continuum, the “high” states of willingness to search and willingness to buy change positively.
| Searching intention | Purchase intention | |||||
|---|---|---|---|---|---|---|
| State | High | Middle | Low | High | Middle | Low |
| High | 0.57 | 0.384 | 0.041 | 0.449 | 0.482 | 0.05 |
| Middle | 0.46 | 0.427 | 0.102 | 0.236 | 0.542 | 0.209 |
| Low | 0.251 | 0.544 | 0.201 | 0.151 | 0.469 | 0.363 |
Table 3. Bayesian inference diagram of channel trust
The Bayesian inference table related to perceived benefits is shown specifically in Table 4. The decreasing probability of high willingness to buy is more pronounced than the decreasing probability of high willingness to search as the consumer’s perception of purchasing interest decreases, suggesting that purchasing interest has a greater impact on online willingness to buy.
State Searching intention Purchase intention High Middle Low High Middle Low High 0.399 0.458 0.123 0.611 0.265 0.116 Middle 0.297 0.479 0.215 0.356 0.561 0.089 Low 0.287 0.448 0.267 0.079 0.809 0.118
Table 4. Bayesian inference diagram of perceived beneϐits
The Bayesian inference table for search willingness in different states is shown in Table 5. When consumers’ willingness to search online is low, their willingness to buy online is also low, indicating that consumers are unlikely to choose the path of offline search-direct online purchase.
State Purchase intention High Middle Low High 0.425 0.483 0.083 Middle 0.232 0.582 0.189 Low 0.0384 0.268 0.638
Table 5. Bayesian Inference Graph of Search Intention
2.3.4. Bayesian diagnosis. The conditional probabilities of transfer cost, perceived beneϐit of purchase and channel trust under the conditions of search willingness and purchase willingness are shown in Table 6. From the table, it can be seen that with the change of search intention and purchase intention of high - medium - low, the probability of transfer cost, perceived beneϐits and channel trust “high” show a gradually decreasing trend of change. In the “high” state of search intention, with the high-middle-low change of purchase intention, the decreasing probability of “high” perceived beneϐit is not obvious, which indicates that the perceived beneϐit is an important reason to attract consumers to choose the online channel to buy the product, while the probability of “high” perceived beneϐit, transfer cost, and channel trust all show a decreasing trend of change. The probabilities of “medium” and “low” for perceived beneϐits, transfer costs and channel trust are all decreasing and then increasing. In the state of “medium” search intention, the change of “high” channel trust is more obvious with the change of purchase intention from high to low.
| Parent level | Perceived benefits | Transfer cost | Channel trust | |||||||
|---|---|---|---|---|---|---|---|---|---|---|
| Searching intention | Purchase intention | High | Middl e | Low | High | Middl e | Low | High | Middl e | Low |
| High | High | 0.79 3 | 0.192 | 0.01 2 | 0.6 | 0.302 | 0.10 5 | 0.61 | 0.376 | 0.01 4 |
| High | Middle | 0.71 2 | 0.266 | 0.01 2 | 0.45 6 | 0.457 | 0.1 | 0.43 | 0.497 | 0.05 9 |
| High | Low | 0.64 4 | 0.297 | 0.04 9 | 0.38 9 | 0.433 | 0.16 5 | 0.12 9 | 0.819 | 0.03 9 |
| Middle | High | 0.47 2 | 0.431 | 0.08 4 | 0.29 8 | 0.526 | 0.17 1 | 0.52 2 | 0.408 | 0.06 9 |
| Middle | Middle | 0.33 1 | 0.596 | 0.06 6 | 0.32 6 | 0.609 | 0.07 3 | 0.34 6 | 0.557 | 0.08 8 |
| Middle | Low | 0.32 9 | 0.564 | 0.06 5 | 0.41 1 | 0.559 | 0.02 6 | 0.17 | 0.62 | 0.21 2 |
| Low | High | 0.20 3 | 0.683 | 0.10 5 | 0.44 2 | 0.305 | 0.25 6 | 0.34 9 | 0.401 | 0.25 1 |
| Low | Middle | 0.15 2 | 0.833 | 0.00 4 | 0.29 | 0.564 | 0.14 2 | 0.14 1 | 0.711 | 0.14 |
| Low | Low | 0.04 7 | 0.835 | 0.10 3 | 0.22 9 | 0.73 | 0.05 7 | 0.05 9 | 0.504 | 0.43 8 |
Table 6. Conditional probability table of search intention and purchase intention
In summary, the prediction and diagnosis of Bayesian network found that search willingness can have an inverse effect on perceived benefits, channel trust, and transfer costs, i.e., assuming that H2(b), H4(b), and H6(b) hold. Willingness to buy can have an inverse effect on willingness to search, perceived benefits, channel trust, and transfer costs, i.e., hypotheses H1(b), H3(b), H5(b), and H7(b) hold.
3. Consumer Behavior Decision Process Model Test
Section titled “3. Consumer Behavior Decision Process Model Test”Structural equation modeling is an analytical method used to estimate and test causality, which can effectively and validate the validity of other models, so that the scientific rationality of the model can be verified. This chapter will test the consumer behavior decision-making model of this paper with the help of structural equation modeling. Next, the principle of structural equation modeling will be studied first to determine the expression formulas of measurement equation and structural equation to provide theoretical padding and support for the subsequent testing and analysis of consumer behavioral decision-making process model.
3.1. Principles of structural equation modeling
Section titled “3.1. Principles of structural equation modeling”Structural equation modeling, also known as latent variable modeling or covariance structural modeling, is a statistical method that integrates factor analysis and path analysis, and is a statistical analysis method based on the principle of covariance matrix of variables to deal with complex multivariate data and analyze the causality between variables [24]. Structural equation modeling consists of two main parts, measurement model and structural model. Measurement modeling involves latent variables and their corresponding observed variables and is based on linear functions of the observed variables.
Structural equation modeling is applicable when studying indicators that are difficult to observe directly and can be portrayed jointly by multiple observable indicators, where indicators that are difficult to observe directly are called latent variables, and if a latent variable can affect other latent variables without being affected by the others, it is called exogenous latent variable, and on the contrary, if a latent variable can be affected by an exogenous latent variable it is called endogenous latent variable. In this case, the measurement equation consists of latent variables and measurable variables, and the structural equation consists of exogenous latent variables over endogenous latent variables.
The measurement equation is expressed as follows.
X = \Lambda_X \zeta + \delta \tag{11}
Y = \Lambda_{Y} \eta + \varepsilon \tag{12}
The expressions for the structural equations are shown below:
\eta = B\eta + \Gamma\zeta + \zeta \tag{13}
where X represents the observation of the exogenous latent variable , Y represents the observation of the endogenous latent variable , X and Y are the factor loading matrices, B is the correlation coefficient matrix, is the regression coefficient matrix, is the exogenous latent variable, represents the endogenous latent variable, which obeys the normal distribution, and it is usually assumed that its covariance matrix is a positive-definite one; , , and are the error terms, which obeys normal distribution, and it is usually assumed that its covariance matrix is a diagonal matrix.
3.2. Research design and data analysis
Section titled “3.2. Research design and data analysis”3.2.1. Data collection. In this chapter, the sample data will be obtained through the questionnaire, and then the structural equation model will be constructed to observe each latent variable such as search willingness, purchase willingness, perceived beneϐit, channel trust, transfer cost, etc. of the Bayesian network-based consumer behavioral decision-making process model proposed in this paper.
The questionnaires were distributed in a number of public places in the Shenzhen area of Guangdong Province, China, with most of them being filled out voluntarily by subjects at Shenzhen University and Shenzhen Institute of Vocational Technology, with links provided in the Liyuan Morning Breeze Forum. Some of the questionnaires were also distributed using a focused sampling method, i.e., in the Dongmen commercial area, Huaqiangbei electronic market, and in front of large shopping malls with high foot traffic in Shenzhen, as well as in parks, schools, and major train stations, in order to make the sample data more representative. Among the 420 questionnaires recovered in this survey, 408 questionnaires were valid, accounting for 97.14% of the recovered questionnaires.
3.2.2. Data testing. Reliability reϐlects the trustworthiness of the measurement. The most commonly used reliability index to measure internal consistency is Cronbach’s alpha coefϐicient (α coefϐicient), which takes a value between 0 and 1. The larger the α value, the higher the reliability of the scale. Some studies have suggested that an alpha value of not less than 0.7 would indicate a good reliability of the scale. In this study, the statistical software SPSS17 was used to carry out the Cronbach’s consistency coefϐicient test, and the speciϐic results are shown in Table 7. As can be seen from the table, the alpha coefϐicients of the questionnaire parts of perceived beneϐit, channel trust, transfer cost, search willingness and purchase willingness are 0.788, 0.796, 0.744, 0.712, 0.712, respectively, all of them are greater than 0.7, which is a high level of reliability, which shows that the data collected in this study are reliable and credible.
Table 7. Reliability analysis results
| Variables | Measurements | Corrected item-total correlation | α if item deleted | Cronbach’s α | |
|---|---|---|---|---|---|
| PB1 | 0.513 | 0.774 | |||
| PB2 | 0.639 | 0.747 | |||
| Perceived benefits | PB3 | 0.583 | 0.761 | 0.788 | |
| PB4 | 0.544 | 0.774 | |||
| PB5 | 0.53 | 0.781 | |||
| OT1 | 0.58 | 0.745 | |||
| Channel trust | OT2 | 0.602 | 0.718 | 0.796 | |
| OT3 | 0.651 | 0.71 | |||
| CTC1 | 0.463 | 0.781 | |||
| Transfer cost | CTC2 | 0.58 0.773 | 0.744 | ||
| CTC3 | 0.576 | 0.747 | |||
| SI1 | 0.408 | 0.771 | |||
| Searching intention | SI2 | 0.552 | 0.703 | 0.712 | |
| SI3 | 0.557 | 0.771 | |||
| Purchase intention | PI1 | 0.436 | 0.745 | ||
| PI2 | 0.492 | 0.718 | |||
| PI3 | 0.45 | 0.71 | 0.712 | ||
| PI4 | 0.357 | 0.753 |
3.3. Validation factor analysis
Section titled “3.3. Validation factor analysis”3.3.1. Internal consistency tests. In this section, the internal consistency test will be further conducted on each factor (latent variable) as a way to judge the intrinsic quality of the measurement model. The internal consistency test is mainly judged by the index of Combined Reliability (CR).The larger the CR value, it means that there is a high degree of correlation between the indicators, and at this time, it can be considered that the measurement of each indicator is consistent; the smaller the CR value, it means that the measurement between the indicators is not consistent. It is generally believed that a CR value of 0.7 or more indicates that the measurements are consistent. The standard loadings and constructed reliabilities of the measurement indicators of each latent variable of the consumer behavioral decision-making process model based on Bayesian network proposed in this paper are shown in Table 8. From the table, it can be seen that the CR value of the combined reliability of each latent variable of perceived beneϐit, channel trust, transfer cost, search willingness, and purchase willingness is greater than 0.7, which is 0.916, 0.837, 0.823, 0.835, and 0.911, respectively.This indicates that the internal consistency of the observed indicators of the ϐive latent variables is high, and that the measurement model has a very good intrinsic quality.
0.911
Purchase intention
| Variables | Measurements | Nominal load | T | R | |
|---|---|---|---|---|---|
| PB1 | 0.696 | 16.12 | |||
| PB2 | 0.838 | 17.94 | |||
| Perceived benefits | PB3 | 0.852 | 18.68 | 0.916 | |
| PB4 | 0.898 | 19.84 | |||
| PB5 | 0.86 | 19.53 | |||
| OT1 | 0.75 | 17.01 | 0.837 | ||
| Channel trust | OT2 | 0.847 | 18.42 | ||
| OT3 | 0.791 | 17.86 | |||
| CTC1 | 0.7 | 15.79 | 0.823 | ||
| Transfer cost | CTC2 | 0.844 | 19.26 | ||
| CTC3 | 0.848 | 19.37 | |||
| SI1 | 0.797 | 18.1 | |||
| Searching intention | SI2 | 0.737 | 19.9 | 0.835 | |
| SI3 | 0.688 | 14.01 | |||
| PI1 | 0.908 | 20.41 | |||
| PI2 | 0.923 | 19.57 |
Table 8. The Standard load and Construct Reliability
3.3.2. Convergent and Distinctive Validity Tests. For the test of convergent validity, the average variance extracted (AVE) can be utilized. It means how much of the variance in the latent variable is from the measure.The larger the AVE, the more the measure explains the latent variable, then it indicates that the measure designed for that latent variable has better convergence. It is generally accepted that measurement models have good convergent validity when the AVE for each latent variable is close to 0.5 or more than 0.5.
PI3 0.804 21.16 PI4 0.696 17.23
The results of the aggregation validity and differentiation validity tests of the consumer behavioral decision-making model in this paper are specifically shown in Figure 2. It can be seen that all AVE values are greater than 0.5, which indicates that the measurement model has a high degree of convergent validity. The AVE value of each variable is greater than the square of the correlation coefficient, i.e., the measurement model is set up so that certain indicators that are not correlated with certain latent variables are indeed not correlated, which indicates that the measurement model also has a high degree of discriminant validity.
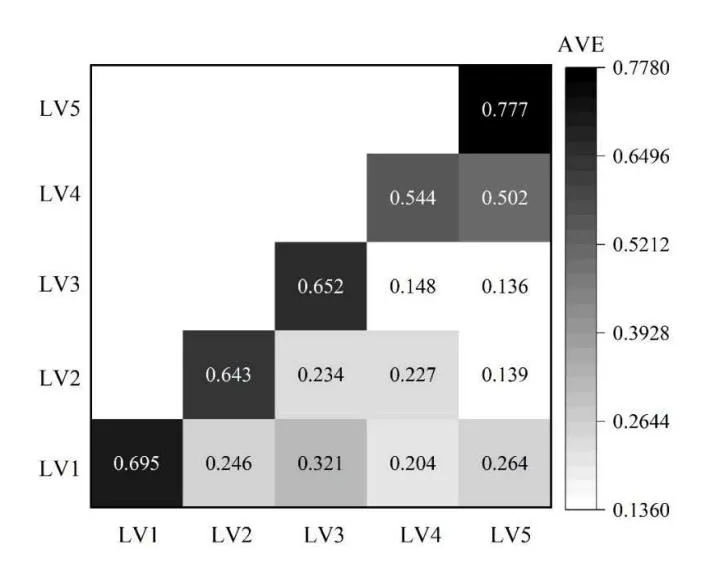
Fig. 2. Test results of convergent validity and discriminant validity
3.4. Analysis of structural equation modeling tests
Section titled “3.4. Analysis of structural equation modeling tests”On the basis of the model of consumer behavioral decision-making process in this paper, AMOS17 is used to construct a structural equation model with five latent variables: perceived benefits, channel trust, transfer cost, search willingness, and purchase willingness, in which perceived benefits, channel trust, and transfer cost are treated as exogenous latent variables, and search behavior and purchase willingness are treated as endogenous latent variables.
3.4.1. Model Fitting and Evaluation. Each ϐitting index of the measurement model constructed in this test is speciϐically shown in Table 9. As can be seen from the table, 2 / df 1.707<2, GFI>0.9, CFI>0.9, IFI>0.9, and GFI>0.8, each ϐitting index meets the requirements, which indicates that the model has a good ϐit.
| Match index | Actual value | Acceptance requirement | Evaluation | |
|---|---|---|---|---|
| 2 | 941.257 | - | - | |
| df | 519 | - | - | |
| 2 / df | 1.707 | <2 | Satisfying | |
| GFI | 0.902 | >0.8 | Satisfying | |
| AGFI | 0.915 | >0.9 | Satisfying | |
| NFI | 0.962 | >0.9 | Satisfying | |
| IFI | 0.962 | >0.9 | Satisfying | |
| CFI | 0.962 | >0.9 | Satisfying | |
| RMSEA | 0.054 | <0.08 | Satisfying |
Table 9. Fitting index
3.4.2. Signiϐicance role relationship test. The results of the signiϐicance test of the 3 exogenous latent variables of perceived beneϐits, channel trust, and transfer costs on the 2 endogenous latent variables of search behavior and purchase intention are speciϐically shown in Table 10. From the running results, the standard regression coefϐicients of each path are signiϐicant, which indicates that the 3 exogenous latent variables of perceived beneϐits, channel trust, and transfer costs have a signiϐicant effect relationship on the 2 endogenous latent variables of searching behavior, and purchase intention (P<0.05), and all of them show a positive correlation relationship and positive inϐluence, assuming that H1(a), H2(a), H3(a), H4(a), H5(a), H6(a), H7(a) were veriϐied.
Path of action relationship Standardized regression coefficient(T) P Significant Perceived Benefits → Search Intention 0.332(0.16) 0.012** Yes Perceived benefit → Purchase intention 0.103(0.49) 0.003*** Yes Channel trust → Search willingness 0.846(0.38) 0.026** Yes Channel trust → Purchase intention 0.134(0.26) 0.014** Yes Transfer cost → Search willingness 0.863(0.16) 0.004*** Yes Transfer cost → Purchase intention 0.201(0.21) 0.025** Yes ** means significant at p<0.05,*** means significant at p<0.01.
Table 10. Test results of signiϐicance
4. Marketing Optimization Strategies for Digital Economy Platforms
Section titled “4. Marketing Optimization Strategies for Digital Economy Platforms”In the above article, this paper builds up a Bayesian network behavioral decision-making model on the basis of Bayesian network, realizes the modeling of consumer behavioral decision-making, and tests
the consumer behavioral decision-making model by using structural equation model. The consumer behavioral decision-making model in this paper visualizes the complex behavioral decision-making process of consumers, which is of great significance to help enterprises better grasp the needs of consumers in the digital economy platform scenario, so as to realize the optimization of precise and personalized marketing strategies. This chapter will propose the optimization path of marketing strategy for digital economy platform on the basis of the consumer behavior decision-making model in this paper.
-
- Strengthen teamwork and resource integration. Effective strategy optimization requires close collaboration between a dedicated team and cross-departmental resources. Establishing a digital economy platform marketing team with market insights and data analysis capabilities, combined with technical support and brand promotion resources, can ensure the efϐicient implementation of the strategy.
-
- Effectively utilize technology and tool support. Data analysis and automation tool application are the core support for the efϐicient implementation of digital marketing. The introduction of advanced data analysis tools can help companies grasp the market dynamics of the digital economy platform in a timely manner and quickly identify new marketing opportunities. At the same time, automation tools can signiϐicantly improve the placement efϐiciency and achieve real-time optimization of personalized push. Through these technical means, enterprises can quickly adjust their strategies to adapt to changes in consumer behavior in the complex market environment, continuously optimize the marketing effect, and adopt a more ϐlexible marketing model to comprehensively enhance the market competitiveness of the brand.
- (3) Establish an effective information feedback mechanism and performance evaluation system. Establishing an effective information feedback mechanism and performance evaluation system is the key to promoting the continuous optimization and improvement of marketing strategy. Through consumer information feedback channels and real-time data monitoring, enterprises can collect users’ actual needs and feedback, and dynamically adjust marketing content and methods. Regular performance evaluation can help companies ϐind deϐiciencies in marketing strategies and take timely improvement measures. By combining consumer feedback and data analysis results, enterprises can more accurately assess the actual effectiveness of the relevant strategies, thus promoting their continuous optimization and improvement and helping to achieve marketing goals.
5. Conclusion
Section titled “5. Conclusion”In this paper, we use Bayesian network to explore the consumer behavioral decision-making process and the key factors affecting the consumer behavioral decision-making process in the digital platform, realize the modeling of the consumer behavioral decision-making process, and construct a model of the consumer behavioral decision-making process based on Bayesian network. In the Bayesian network construction of consumer behavioral decision-making, the latent variables of perceived benefits, channel trust, transfer cost, search willingness, and purchase willingness show significant differences in each dimension (P<0.05). Through the Bayesian prediction, the analysis can know that with the change of transfer cost, channel trust, perceived benefit along the high-middle-low, online search willingness, purchase willingness and consumption behavior positively change. In the Bayesian diagnosis, the probability of transfer cost, perceived benefit and channel trust being “high” shows a decreasing trend as willingness to buy and willingness to search change along the high-middle-low scale. Overall, search willingness can have an inverse effect on perceived benefits, channel trust, and transfer costs, while purchase willingness can have an inverse effect on search willingness, perceived benefits, channel trust, and transfer costs.
Structural equation modeling is applied to the scientific rationality test analysis of the consumer behavioral decision-making process model in this paper. The CR values of each latent variable, such as perceived benefit, channel trust, transfer cost, search willingness, and purchase willingness, are 0.916, 0.837, 0.823, 0.835, and 0.911, respectively, which are all greater than 0.7, and each latent variable possesses high internal consistency. The average variance extracted (AVE) is utilized to determine the aggregation effect, and the AVE value of each latent variable in this paper’s model is also higher than 0.5.The exogenous latent variables are analyzed for the structural equation paths of the endogenous latent variables to carry out the significance test. The results show that exogenous latent variables such as perceived benefits, channel trust, and transfer costs have a significant positive effect relationship on endogenous latent variables such as search behavior and purchase intention.
References
Section titled “References”-
[1] Ahmedov, I. (2020). The impact of digital economy on international trade. European Journal of Business and Management Research, 5(4).
-
[2] Zhang, W., Zhao, S., Wan, X., & Yao, Y. (2021). Study on the effect of digital economy on high-quality economic development in China. PloS one, 16(9), e0257365.
-
[3] Stoϐkova, K. R., Laitkep, D., & Stoϐkova, Z. (2022). Shopping behavior in the context of the digital economy. Journal of Risk and Financial Management, 15(2), 39.
-
[4] Gazzola, P., Colombo, G., Pezzetti, R., & Nicolescu, L. (2017). Consumer empowerment in the digital economy: Availing sustainable purchasing decisions. Sustainability, 9(5), 693.
-
[5] Frick, V., & Matthies, E. (2020). Everything is just a click away. Online shopping efϐiciency and consumption levels in three consumption domains. Sustainable Production and Consumption, 23, 212-223.
-
[6] Zhu, M., Wang, Y., Wei, M., & Cai, Z. (2023). How does digital ϐinance affect consumer online shopping: A comprehensive analysis based on econometric model. Finance Research Letters, 54, 103734.
-
[7] Badescu, R., & Hrib, B. (2021, June). Consumers’ perception on information overload in a digital society. In Proceedings of the 7th International Conference on New Trends in Sustainable Business and Consumption (BASIQ), Online (pp. 3-5).
-
[8] Xu, Z. X., Zhu, Y., & Yang, S. (2022). Tackling false advertising and strengthening consumer protection in emerging economies. Journal of General Management, 03063070221145859.
-
[9] Zhu, J. (2024). The impact of merchant-induced reviews on consumers’ shopping behavior from the perspective of the digital economy. Current Psychology, 43(40), 31206-31221.
-
[10] Almeshal, S. A., & Almawash, M. M. (2023). Peer and parent inϐluence on consumer behavior buying decision making: an empirical study among saudi female consumers. British Journal of Management and Marketing Studies, 6(1), 1-16.
-
[11] Prasath, P., & Yoganathen, A. (2018). Inϐluence of social media marketing on consumer buying decision making process. SLIS Student research journal, 1(1), 1-12.
-
[12] Géci, A., Krivošıḱ ová, A., Nagyová, Ľ., & Cagáňová, D. (2020). The inϐluence of lifestyle on consumer behavior and decision making in research aimed at protein bars. Slovak Journal of Food Sciences, 14.
-
[13] Musumali, B. (2019). An Analysis why customers are so important and how marketers go about understanding the customer decision-making process and the various individual and socio-cultural inϐluences on decision-making process. Business and Marketing Research Journal (BMRJ), 23(23), 230- 246.
-
[14] Mai, T. D., Tam, N. T., Tran, G. T., Hue, T. N. D., Liem, V. T., Han, N. D. N., & Dang, S. (2022). Consumers’ decision-making mechanism differs under the presence of risk, habits, and past behavior for organic ϐisheries foods. Food Science and Technology, 42, e94022.
-
[15] Qazzaϐi, S. H. E. I. K. H. (2019). Consumer buying decision process toward products. International Journal of Scientiϐic Research and Engineering Development, 2(5), 130-134.
-
[16] Kumar, A., Mangla, S. K., Luthra, S., Rana, N. P., & Dwivedi, Y. K. (2018). Predicting changing pattern: building model for consumer decision making in digital market. Journal of Enterprise Information Management, 31(5), 674-703.
-
[17] Karimi, S., Holland, C. P., & Papamichail, K. N. (2018). The impact of consumer archetypes on online purchase decision-making processes and outcomes: A behavioural process perspective. Journal of Business Research, 91, 71-82.
-
[18] Tang, M., & Zhu, J. (2019). Research of O2O website based consumer purchase decision-making model. Journal of Industrial and Production Engineering, 36(6), 371-384.
-
[19] Petcharat, T., & Leelasantitham, A. (2021). A retentive consumer behavior assessment model of the online purchase decision-making process. Heliyon, 7(10).
-
[20] Yang, M., Chen, H., Long, R., Wang, Y., & Sun, Q. (2023). The group decision-making evolution of green consumption behavior under overreaction: Based on multi-agent simulation analysis. Resources, Conservation and Recycling, 193, 106982.
-
[21] Vieira, D. M., Enes, Y. D. S. O., da Silva Campos, A. G., Ouro-Salim, O., & Guarnieri, P. (2024). A model of the consumer decision-making process for the disposal of goods. Environment, Development and Sustainability, 26(11), 28423-28448.
-
[22] Junhua Zheng,Yue Zhuo,Xiaoyu Jiang,Lingquan Zeng & Zhiqiang Ge. (2025). Advances in Bayesian networks for industrial process analytics: Bridging data and mechanisms. Expert Systems With Applications126670-126670.
-
[23] Meng Huixing,An Xu & Xing Jinduo. (2022). A data-driven Bayesian network model integrating physical knowledge for prioritization of risk inϐluencing factors. Process Safety and Environmental Protection(prepublish).
-
[24] Njål Foldnes,Jonas Moss & Steffen Grønneberg. (2025). Improved Goodness of Fit Procedures for Structural Equation Models. Structural Equation Modeling: A Multidisciplinary Journal(1),1-13.