Do Specific Text Features Influence Click Probabilities In Paid Search Advertising
Keywords: Bayesian Statistics, Bayesian Analysis of Variance, Search Engine Advertising, Sponsored Search, Paid Search Advertising, Multivariate Testing.
Abstract: Paid Search Advertisers have only very few options to influence the user’s decision to click on one of their ads.
1 INTRODUCTION
Section titled “1 INTRODUCTION”Internet search engines play a key role in the modern information society. Not only do they serve the information needs of their users but they also represent an important source of customer acquisition for a variety of companies (Jansen and Mullen, 2008; Alby and Funk, 2011). Internet search engine companies also generate significant amounts of revenue through Paid Search Advertising. While still growing rapidly, Paid Search Advertising already dominates the online media spending of companies that advertise on the internet. Developed in 1998 by Overture, this form of advertising uses text advertisements and a list of keywords. The advertiser also usually provides attributes to each of these keywords, but always indicates the amount of money he is willing to pay for a click on an ad for a specific keyword (CPCmax)(Jansen et al., 2009). Every time a user types a query into a search engine, personalized result pages are generated based on the user’s location, search history and other factors. If ads are available that could probably satisfy the need of the user, the search engine displays these ads alongside the organic results. If more than one advertiser is willing to pay for the display of an ad, the search engine typically auctions the position of these ads among all interested parties through a Generalized Second Price Auction (GSP) (Jansen, 2011; Varian, 2009). Only the advertiser that wins the auction by getting a click on its ad is charged by the search engine. The effective Cost-Per-Click (CPCe f f) is the maximum bid of the advertiser with the subsequent highest bid plus a small additional fee. In practice, search engine companies use a more robust mechanism to maximize their profits by rewarding keyword/ad combinations that have a high relevance to users (often referred to as the quality score). Although detailed calculations are not disclosed, the key metric is claimed to be the historic Click-Through Rate (CT R) where available, otherwise an expected click probability for the specific advertiser-ad-keyword combination is used. An interesting issue for advertisers is how to maximize the probability that a given user will click on one of their advertisements, ultimately fulfilling a defined goal on their website. In practice there are only limited options to do so. One is to optimize the relevance of an advertisement by only choosing keyword / landing page combinations that provide a suitable offer to the respective query of a given user. Additionally, advertisers can maximize click probability by influencing the position of an ad on the SERP via the CPCmax and by improving the ad quality. Finally, optimizing the wording of creatives to communicate advantages over the competition may help users with their decision on which ad to click. In the present paper we concentrate on the impact of various signals in text advertisements. We analyze a non-reactive multivariate test in which users are confronted with some defined variations of ads containing information on trust and
Copyright c 2014 SCITEPRESS (Science and Technology Publications, Lda.)
pricing that has been differently formulated or completely omitted. We evaluate the probability that a user will click on a given Paid Search text ad by using a Bayesian Analysis of Variance (BANOVA). Finally, we illustrate that variations in the text of a creative have significant influence on click probabilities in Paid Search.
2 PAID SEARCH ADVERTISING
Section titled “2 PAID SEARCH ADVERTISING”An interesting topic for the current research is evaluating the factors that influence the probability that a given user will click on a specific advertiser’s ad. These factors have been widely studied since Paid Search Advertising first began; however, due to a lack of opportunity to observe search engine user behavior, complete coverage of all factors influencing the click probability is no easy task. Evidence suggests that one of the most influential factors is the ad position within the Paid Search results, which depends on the CPCmax and quality score. The quality score is used by search engines to determine the quality of an advertisement and is based primarily on the historical CT R of a given keyword/ad combination. There is a strong correlation between decreasing ad position and a decreasing CT R (Richardson et al., 2007; Agarwal et al., 2011). In principle, the top positions lead to high CT Rs. From an advertiser’s perspective, it is appealing to be able to predict the future CT R of a given ad or even better to find rules for predicting click probability in advance. As research has progressed, several models have been developed to explain the influence of the position bias on the CT R.
Crasswell, Zoeter and Taylor (Craswell et al., 2008) present several models for predicting the CT R: (a) baseline model, (b) mixture model, (c) examination model, and (d) cascade model . The findings were originally based on organic search results, but they are applicable to Paid Search results as well (Agarwal et al., 2011). The underlying assumption of the (a) baseline model is that a user screens every search result and then decides, which one best fits the query. As a result, the click probabilities for each individual search result are identical and independent of its position. The (b) mixture model extends the baseline model and divides user behavior into two groups. One group behaves as described in the baseline model, while the other group clicks randomly on one of the first search results. The (c) examination model refers to findings from eye tracking studies, which state that, with declining position, the probability of a click also declines (Joachims et al., 2005; Joachims et al., 2007). The (d) cascade model is, owing to the high degree of explanation by click data, one of the most applied explanation approaches. The basic assumption is that the user scans each search result from top to bottom, comparing the relevance of each ad with the relevance of the ad before it. The user continues scanning the results until the perceived ad relevance reaches a certain level and the user clicks.
One challenge is to predict the CT R of keywords or keyword combinations for potential future Paid Search ads. A proposed solution is aggregating historical data from similar keywords (Regelson and Fain, ). Here, the CT R is represented as a function of position, independent of a bid. The resulting developed models do not focus on a certain advertiser. The same clustering approach can be applied in optimizing the search engines’ profit (Dave and Varma, 2010). There are also models that take into account the quality score (Gluhovsky, 2010). The General Click Model model developed by Zhu et al. (Zhu et al., 2010), focuses on the CT R prediction of long-tail queries, based on a Bayesian network.To address the the aforementioned position bias, Zhong et al. (Zhong et al., 2010) incorporate post-click user behavior data from the clicked ad’s landing page into the click model to refine the estimation of the perceived user relevance after clicking on a specific ad. A similar approach using Dynamic Bayesian networks can be found in Chappelle and Zhang (Chapelle and Zhang, 2009). Several models based on historical click data are limited in that they lack consideration of a possible user learning effect. Taking Gauzente’s results as an example, it has been shown that past user satisfaction with Paid Search results influences current click behavior (Gauzente, 2009). In addition to the incorporation of position data and the perceived relevance of presented ads, the CT R of an advertisement is also affected by the relationship between organic and Paid Search results. Listing the results in Paid and organic search results for one company at the same time leads to a higher CT R(Yang and Ghose, 2010; Blask et al., 2011). What has often been overlooked is the influence that specific text patterns have on click probabilities.
3 CASE STUDY
Section titled “3 CASE STUDY”It is part of a Paid Search Advertising manager’s daily routine to test different versions of a specific ad. In practice, at least two variations of an ad are tested against each other in each ad group. One commonly method is to replace the weaker performing version of an ad with the stronger variation after enough clicks are generated to identify which one is performing better. Anecdotal evidence and personal experience often play an important role in this process, and the knowledge gained from tests is often not preserved within an organization. In this paper we present a method for multivariate tests based on historical data that is able to enhance the options of working with unbalanced study designs in A/B and multivariate tests. This ultimately improves advertisers’ ability to recognize low performing ads sooner than with conventional ANOVA methods. What makes these models interesting is the ability to take prior knowledge into account where only sparse data are available.
Top Car-Buying Brand Top Car-Buying Brand car-buying-brand.com car-buying-brand.com Your Favorite Car Brand & Model Your Favorite Car Brand & Model Specific Pricing Information Trust Seal Information & No Deposit Top Car-Buying Brand Top Car-Buying Brand car-buying-brand.com car-buying-brand.com Your Favorite Car Brand & Model Your Favorite Car Brand & Model Trust Seal Information & Rebate Some other Text
Figure 1: Variations of Paid Search ads similar the textual ads used for this study.
AND
For this study, selected elements have been altered in a number of Paid Search text advertisements for very similar commercial Google search queries. These queries may lead to a business offer from the advertiser and an online product purchase, as can be seen in fig. 1. The advertisers’ product is a major investment for the average private customer. The data were generated directly by Google Adwords as part of the normal conducted from 2012 to 2013. The resulting data set contains a large number of Paid Search key performance indicators (KPI) for the given period. All advertisements that had less than 100 impressions in the given period were filtered out. To ensure that only the impact of the specific text alteration is analyzed and to exclude other factors that would blur the results (especially the aforementioned strong position effects), we only analyze the advertisements that were displayed above the organic search results and that were part of the described multivariate test. For this study, we take almost 3 million ad impressions resulting in more than 300,000 clicks and a total of 1.976 ads into account. The occurrences of the examined text features in the ads are shown in table 1. The aggregated CTR for each ad over the whole test period is used for the analysis. The resulting mean CTRs are displayed in fig 3. The nominal variables Title, Body 1, Body 2, Display-URL of the landing page for each ad are also included.
In this study we want to predict the metric variable CTR by using the described nominal textual predictors. As such, ANOVA is a valid method of choice for us. For the given data the model can be formulated as written in equation (1) with the predictor variables
presence of trust seal information and presence of pricing information denoted as and . serves as a deflection parameter. indicates the baseline value of the prediction. For example, if is at the value of , a deflection of is added to the baseline. Ultimately the sum of all deflections of and have to have a sum of zero for both predictors.
with the constraints
Even a brief look at the numbers in table 1 makes it clear that the research design is not very well balanced. Only four ads contain trust seal and concrete pricing information from the advertiser’s database, while 345 contain no trust seal information but do include concrete pricing information. This could lead to serious computational difficulties in traditional ANOVA, which is the reason that we follow Kruschke’s approach (Kruschke, 2010). We use a Bayesian estimation to perform the data analysis using a hierarchical prior as illustrated in fig. 2 . The goal of this analysis is to estimate the additive and interactive values for each level of .
The following assumptions are made regarding the hierarchical prior: The observed data is assumed to be normally distributed around the predicted value or central tendency . As defined and illustrated by Kruschke (Kruschke, 2010), the equation above the observed data distribution in fig 2 illustrates that the predicted value is composed from the baseline plus additive deflection caused by each predictor individually, and interactive deflection caused by the combination of the given predictors. The basic assumptions about the respective can be found in the distributions in the top level of fig. 2. Here, we indicate that all are normally distributed around zero. The variances of all are estimated from the given data. The hyperdistributions are applied separately to the various predictors and interactions. This is due to the assumption that the magnitude of the effect of the predictive variable is probably not informative on the magnitude of the effect of (Kruschke, 2010).
As previously mentioned, we want to predict CTR using variations of the nominal predictors “trust seal information” and “pricing information”, denoted
| no trust info(X1A1) | test winner(X1A2 | trust seal(X1A3) | |
|---|---|---|---|
| no pricing(X2B1) | 789 | 99 | 330 |
| no deposit(X2B2) | 20 | 35 | 91 |
| save x %(X2B3) | 91 | 84 | 101 |
| real price(X2B4) | 39 | 306 | 4 |
Table 1: Occurences of text features in the dataset (trust information(x1) and pricing information(x2)).
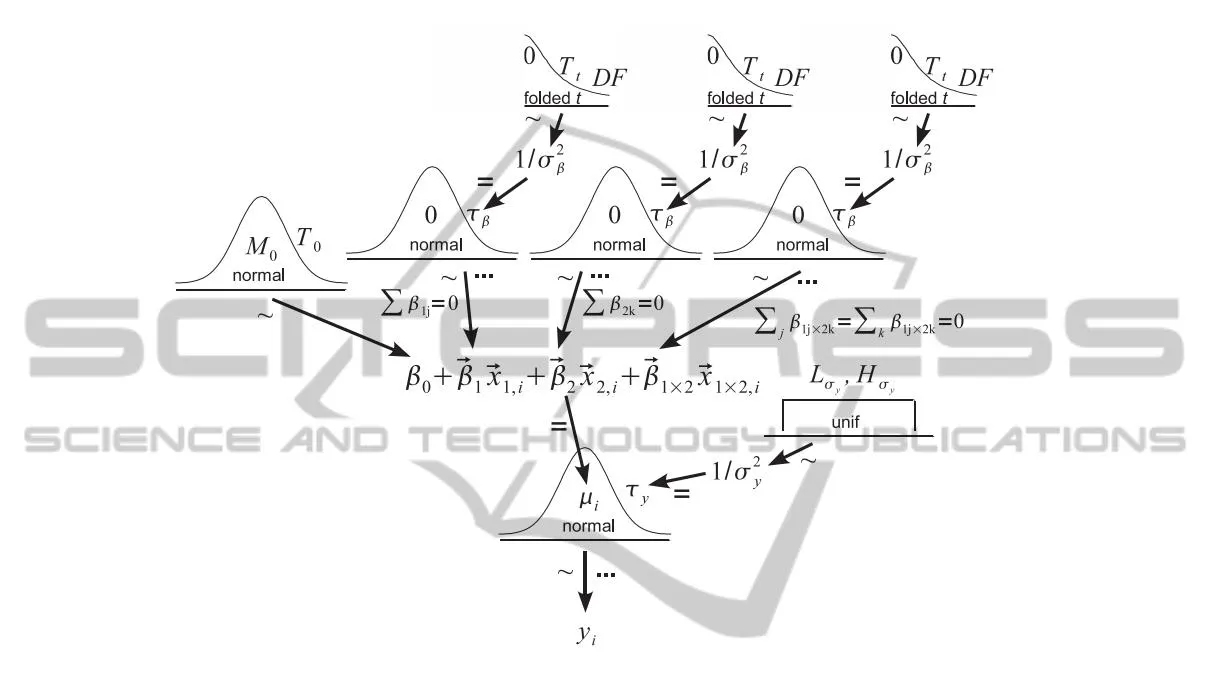
Figure 2: Hierarchical dependencies for two-way BANOVA (Kruschke, 2010).
as x⃗1 and x⃗2. Both variables have several levels. x⃗1 includes “no trust information given” (x1A1), “unspecified test winner information given” (x1A2) and “concrete trust seal and test winner information given”(x1A3). x⃗2 includes “no pricing information”(x2B1), “no deposit”(x2B2), “percentage of savings given”(x2B3) and “concrete pricing information from database given”(x2B4). Although that we have an unbalanced study design and very few observations for one of the cases, we can see from fig 3 that ads with different contents gain significantly varying CT Rs.
The results of the Bayesian analysis concerning the effects of the text features are shown in fig 4. The top left histogram shows that the baseline (β0) for the given combinations of text features is at 0.114. This is quite high in terms of average Click-Through Rates in Paid Search Advertising in general, at least for such a great number of queries as we observed within the test period in the context of the given campaigns. This could be a good hint for the fact that the campaigns have already been very well organized and optimized in terms of relevance to the specific queries that lead to the display of ads of the given advertiser on Search Engine Results Pages. Which influences selected text features have in such an environment can be seen in the remaining histograms in fig. 4. Each histogram illustrates deflections from the baseline for any given feature combination. The third histogram in the first row for example indicates that 95% of the most credible values that have to be subtracted from the baseline to describe the effect of the text feature “unspecified test winner information” fall in the area between 0.0282 and 0.0164 (β12) with the most probable value at 0.0213. What is really interesting and makes this kind of analysis so helpful in the case of unbalanced study design is the additional information concerning the 95% HDI (Highest Density Interval) for each estimation. This interval illustrates the area in which 95% of all credible parameter values for the respective level of a variable are situated. This becomes especially important when it comes to levels of a variable with only very few observed data points where the ingroup variance is estimated with the help of the prior
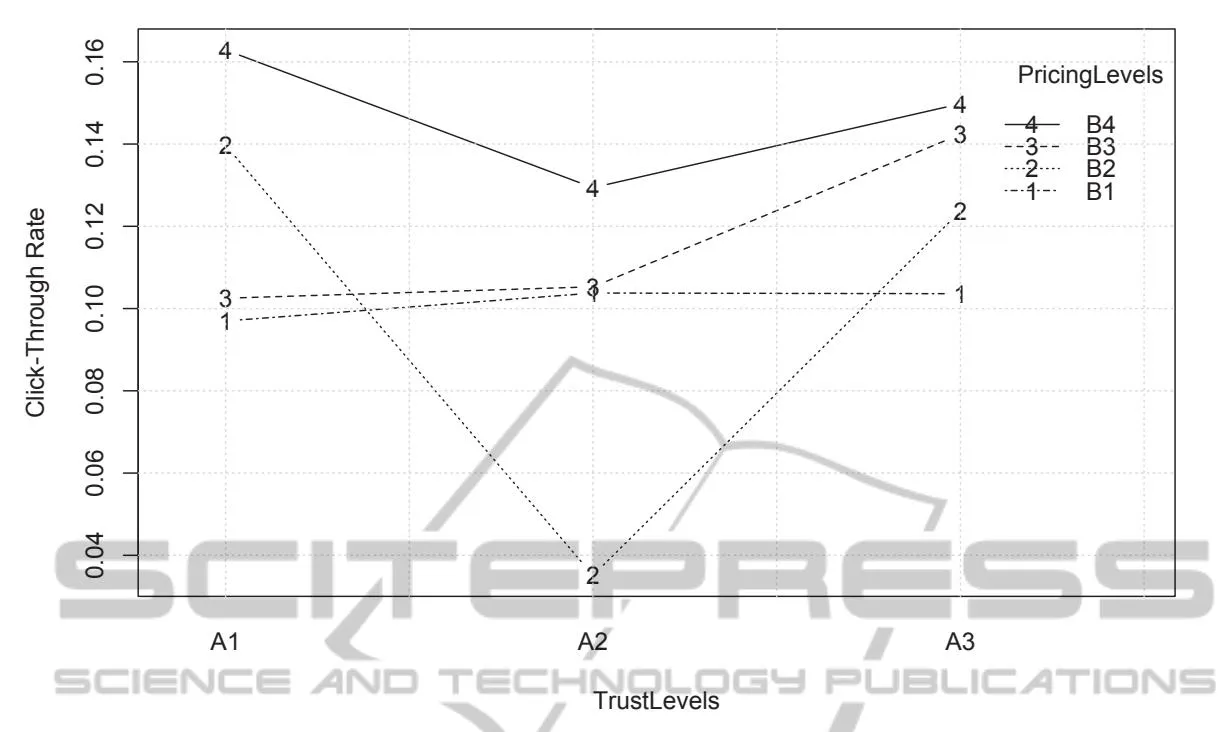
Figure 3: Mean CTR values for ads with different text feature combinations.
knowledge from other levels within the same predictive variable.
We estimate the effects for each of the groups but we are also interested in the answer to the question whether the groups are credibly different from each other. In typical A/B test scenarios for example this can be examined by applying an NHST t-test or a Bayesian Parameter Estimation of t-distributions for the comparison of two groups (Kruschke, 2012; Blask, 2013). For the case of more than two predictive variables this can also be done via contrast analysis in Multifactor Analysis of Variance (MANOVA).
What we additionally want to investigate in this study is the overall effect of having information about a trust seal in the Paid Search Ads of the advertiser and the effects of various levels of pricing information. One answer to this question comes from the analysis whether there is a credible difference in click probabilities between ads that do not contain any specific trust information and and those that include the text feature ( and ). The histograms in fig 5 that the effect of having unspecified test winner information in the ad does not help the advertiser to gain a higher CTR. In fact the analysis does reveal that having no trust information is credibly better than the announcement of an unproven test winner statement. Including a trust seal information into the ad does not have such a negative effect. In fact about
two thirds of the credible values for the effect, including the most probable value, indicate that this feature may slightly help the advertiser. What is also true is that the zero value is included in the 95% HDI what makes it very probable that there is no credible improvement in the advertisers performance by including this feature. What we can derive from the analysis is the fact that it makes credibly more sense to include the proven trust seal into the ad compared to unproven test winner statement as can be seen in the right histogram in fig 5. So, in terms of trust seal information it becomes quite clear what the better choice might be for the given company. It makes no mistake by taking concrete and proven information on trust seals into their ads. What they should not expect is a significant boost in terms of click probability.
What is not so clear until now is the question which level of pricing information finally leads to the best click probability. What we can see is that there seem to exist two differently performing clusters. On the one hand there are the ads that contain a concrete pricing information from the database of the given advertiser ( ) and ads that contain a specific discount in percent as text feature ( ) and on the other hand there are the ads with no pricing information at all ( ) and those advertising that no deposit has to be made ( ). These two groups are credibly different from each other as can be seen in the histograms in fig

Figure 4: Beta value posterior distributions for each variation given the data ( seal informaton ( :A1 = no trust info, :A2 = unspecified test winner information, :A3 = concrete trust seal and test winner information), information ( :B1 = no pricing, :B2 = no deposit, :B3 = save , :B4 = concrete pricing information from database)).
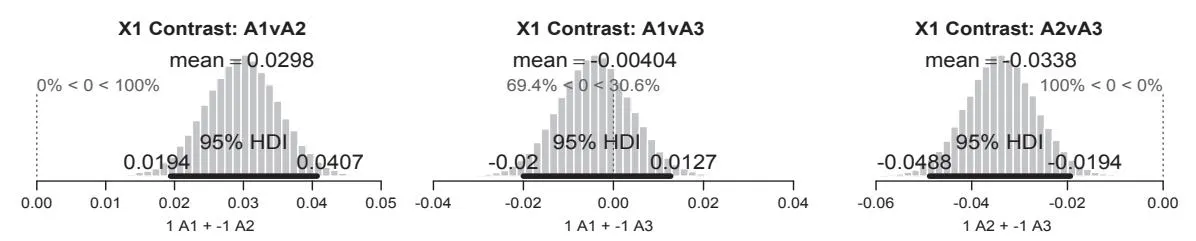
Figure 5: Contrasts for various levels of trust seal information (X1).
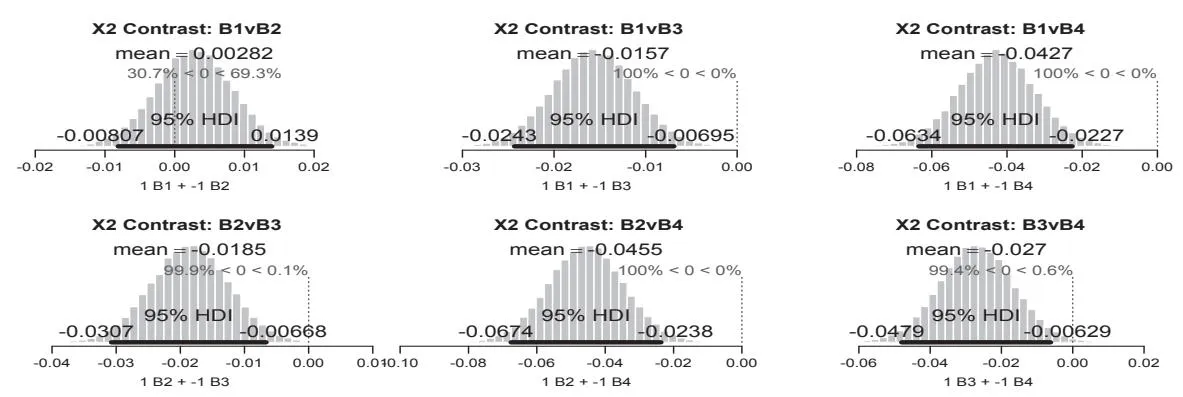
Figure 6: contrasts for various levels of pricing information (X2)
- In detail, everything, including no pricing information at all (x2B1), seems to be be better than advertising “no deposit” (x2B2). The next best text feature in terms of pricing is to give an exact value for the percentage that a user can save on the advertiser’s website (x2B3). This feature is performing credibly better than those mentioned above. What is the best way to communicate pricing in Paid Search Ads - given the data - is to provide exact pricing information from the advertiser’s database (x2B4). In fact it is credibly superior to any other feature in terms of pricing communication, given the observed data.
4 CONCLUSIONS AND OUTLOOK
Section titled “4 CONCLUSIONS AND OUTLOOK”What we applied in this paper offers a valid way to evaluate text features and other nominal predictive variables where tests are an essential part of the daily business. In terms of substantive issues it is the hard facts that the potential customers are looking for when they research in a search engine. The more specific information on pricing is provided in an ad - the better is the chance of winning the customers click. Building up trust is one good feature for an advertiser to support this effect or even substitute parts of this positive effect if they do not have competitive prices or special rebates available. In this specific case this has been achieved by communicating the existence of a credible trust seal in the ad-copy. What we did not asses in this research but would find interesting for an ongoing investigation is the question whether these findings have additional impact on the conversion probability on the advertiser’s landingpage as well. Applying Bayesian ANOVA to multivariate tests in Online Advertising, especially Paid Search Advertising, has various advantages compared to applying conventional Analysis of Variance. This is especially true for unbalanced data like the present one. One obvious limitation to the results is that they should probably only be true for advertisers with competitive prices. Additionally this test should be repeated for a number of other advertisers from various industries to answer the question whether these observations can be generalized.
REFERENCES
Section titled “REFERENCES”Agarwal, A., Hosanagar, K., and Smith, M. D. (2011). Location, Location, Location: An Analysis of Profitability of Position in Online Advertising Markets. Journal of Marketing Research, 48(6):1057.1073.
-
Alby, T. and Funk, B. (2011). Search Engine Marketing in Small and Medium Companies: Status Quo and Perspectives. In Cruz-Cunha, M. and Varajao, J., editors, ˜ E-Business Managerial Aspects, Solutions and Case Studies, pages 206–221. igi-global.
-
Blask, T. (2013). Applying Bayesian Parameter Estimation to A / B Tests in E-Business Applications : Examining the Impact of Green Marketing Signals in Sponsored Search Advertising. In Proceedings of the International Conference on e-Business (ICE-B 2013).
-
Blask, T., Funk, B., and Schulte, R. (2011). Should Companies Bid on their Own Brand in Sponsored Search? In Proceedings of the International Conference on e-Business (ICE-B 2011), pages 14–21, Seville, Spain.
-
Chapelle, O. and Zhang, Y. (2009). A dynamic bayesian network click model for web search ranking. In Proceedings of the 18th international conference on World wide web - WWW ‘09, page 10, New York, New York, USA. ACM Press.
-
Craswell, N., Zoeter, O., Taylor, M., and Ramsey, B. (2008). An experimental comparison of click position-bias models. In Proceedings of the international conference on Web search and web data mining - WSDM ‘08, page 8, New York, New York, USA. ACM Press.
-
Dave, K. S. and Varma, V. (2010). Learning the clickthrough rate for rare/new ads from similar ads. In Proceeding of the 33rd international ACM SIGIR conference on Research and development in information retrieval - SIGIR ‘10, number July, page 897, New York, New York, USA. ACM Press.
-
Gauzente, C. (2009). Information search and paid results proposition and test of a hierarchy-of-effect model. Electronic Markets, 19(2-3):163–177.
-
Gluhovsky, I. (2010). Forecasting Click-Through Rates Based on Sponsored Search Advertiser Bids and Intermediate Variable Regression. October, 10(3):1–28.
-
Jansen, B. and Mullen, T. (2008). Sponsored search: an overview of the concept, history, and technology. International Journal of Electronic Business, 6(2):114– 131.
-
Jansen, B. J., Flaherty, T. B., Baeza-Yates, R., Hunter, L., Kitts, B., and Murphy, J. (2009). The Components and Impact of Sponsored Search. Computer, 42(5):98– 101.
-
Jansen, J. (2011). The Serious Game of Bidding on Keywords. In Understanding Sponsored Search Core Elements of Keyword Advertising, chapter 8, pages 176– 201. Cambridge University Press.
-
Joachims, T., Granka, L., Pan, B., Hembrooke, H., and Gay, G. (2005). Accurately interpreting clickthrough data as implicit feedback. In Proceedings of the 28th annual international ACM SIGIR conference on Research and development in information retrieval - SI-GIR ‘05, page 154, New York, New York, USA. ACM Press.
-
Joachims, T., Granka, L., Pan, B., Hembrooke, H., Radlinski, F., and Gay, G. (2007). Evaluating the accuracy of implicit feedback from clicks and query reformulations in Web search. ACM Transactions on Information Systems, 25(2):1–26.
-
Kruschke, J. K. (2010). Doing Bayesian Data Analysis : A Tutorial with R and BUGS, volume 1. Academic Press.
-
Kruschke, J. K. (2012). Bayesian Estimation Supersedes the t Test. Journal of experimental psychology. General.
-
Regelson, M. and Fain, D. C. Predicting Click-Through Rate Using Keyword Clusters. In ACM, editor, EC’06.
-
Richardson, M., Dominowska, E., and Ragno, R. (2007). Predicting clicks: estimating the click-through rate for new ads. In Proceedings of the 16th international conference on World Wide Web, pages 521–530. ACM New York, NY, USA.
-
Varian, H. (2009). Online ad auctions. American Economic Review, 99(2):430–434.
-
Yang, S. and Ghose, A. (2010). Analyzing the Relationship Between Organic and Sponsored Search Advertising: Positive, Negative, or Zero Interdependence? Marketing Science, 30(1):1–22.
-
Zhong, F., Wang, D., Wang, G., Chen, W., Zhang, Y., Chen, Z., and Wang, H. (2010). Incorporating post-click behaviors into a click model. Annual ACM Conference on Research and Development in Information Retrieval, pages 355–362.
-
Zhu, Z., Chen, W., Minka, T., Zhu, C., and Chen, Z. (2010). A novel click model and its applications to online advertising. In Proceedings of the third ACM international conference on Web search and data mining, pages 321–330. ACM.