Integrating Keyword Segmentation And Budget Allocation Decisions In Sponsored Search Advertising
ABSTRACT
Section titled “ABSTRACT”Budget-constrained sponsored search advertisers must decide how to allocate their advertisement budget across ad campaigns and individual keywords. In this paper, a simulation model that integrates the complex issues involved in keyword segmentation and campaign organization is used to evaluate performance of various budget allocation strategies. Using the buying funnel model as the basis for keyword segmentation and campaign organization, the authors analyze volume-based, cost-based, and clicks-based budget allocation strategies and evaluate their performance implications for different firms. The simulation model is empirically evaluated using four Fortune 500 companies and their keyword data obtained from a leading provider of keyword research technology. The results and statistical analyses show significant improvements in budget utilization using the proposed allocation strategies over a baseline commonly used in practice. The study offers useful insights into the budget allocation problem by leveraging a theoretical framework for keyword segmentation and campaign management.
Keywords
Section titled “Keywords”Ad Budget Allocation, Ad Campaign Organization, Google Advertising, Keyword Search, Keyword Segmentation, Paid Search Advertising, Simulation Modeling, Sponsored Search Advertising
Introduction
Section titled “Introduction”Keyword segmentation and budget allocation are interdependent and complex decisions in search advertising (Ayanso & Mokaya, 2013; Ayanso & Karimi, 2015; Jansen & Spink, 2009). Despite many studies on mechanism design and bidding strategies for keyword auctions (Vragov and Shang, 2020; Vragov et. al, 2019), there has been limited research on the ad budget allocation problem. Search advertisers must decide which keywords to bid on, how to organize ad campaigns, and how much they should spend across planning horizons, campaigns, and individual keywords (Zhang & Feng, 2011; Yang et al., 2012; Yang et al., 2014). With millions of dollars being spent daily on search advertising, efficient allocation of the budget is of great importance.
This study attempts to bridge the research gaps around the issues of keyword segmentation, campaign organization and budget allocation in the search advertising body of knowledge. The study addresses these issues by leveraging an existing marketing framework as a theoretical lens and simulation modelling as a method of capturing this complex process. It examines whether advertisers can improve their budgeting decisions by employing keyword segmentation and performancebased budget allocation strategies. Specifically, using the buying funnel model (Jansen & Schuster, 2011) as the basis of keyword segmentation and campaign organization, this study examines Costbased, Volume-based, and Clicks-based budget allocation strategies and evaluates the performance implications for firms with different product/service offerings.
Anecdotal evidence from search advertising practices shows that most advertisers manage a large number of accounts, campaigns, and keywords that vary in performance, budget consumption, and advertising goal orientation. To remain competitive, firms need to know the various decisions involved in search engine advertising as well as competitors’ campaign strategies in both organic (natural) and paid search advertising (Ayanso & Karimi, 2015; Jansen & Mullen, 2008). The absence of a systematic framework and decision support tools for many of the tasks involved in this process could lead to arbitrary decisions and resource inefficiencies. In addition, measuring keyword-level performance is important because paid search advertising operates at the keyword level (Özlük & Cholette, 2007; Rutz, Bucklin, & Sonnier, 2012). Given the significant amount of money spent on keyword advertising, marketers need broader insights into this process (Dhar & Ghose, 2010; Jansen, Sobel, & Zhang, 2011; Lu & Zhao, 2014). Effective keyword management requires identifying and creating different categories of keywords for improved budget utilization. Therefore, from a theoretical view, this study offers a unique insight into the budget allocation problem by leveraging the buying funnel model as the theoretical foundation, as well as integrating the campaign budget allocation decision with keyword segmentation.
Among the specific challenges advertisers face is the volatility in search demand which may have a direct effect on the performance of campaigns by causing budgets to run out early. In order to better manage their productive keywords, advertisers need to measure performance on a continuous basis and assess their impact on budget utilization. Therefore, from a practical perspective, this study provides insights into operational issues related to budget utilization as well as keyword categorizations that align with campaign strategies and objectives.
The rest of this paper is organized as follows. In the next section, we provide a review of the relevant literature in search engine advertising (SEA) and highlight the theoretical foundations. The following section presents the problem formulation and decision scenarios, along with details of the simulation model. Then, the experimental setting, the data and performance metrics used in this study are presented, followed by the simulation results. After discussing the results and their implications, the paper concludes and outlines the study’s limitations and future research directions.
Related Literature and Theoretical Foundations
Section titled “Related Literature and Theoretical Foundations”In the literature, bid price optimization and budget allocation have been studied in pursuit of different performance objectives, including the maximization of expected clicks (Muthukrishnan, Pál, & Svitkina, 2010; Yang et al., 2014), or other forms of return on investment (Chaitanya & Narahari, 2010; Cholette, Özlük, & Parlar, 2012; Dayanik & Parlar, 2013; Yang et al., 2012; Zhang et al., 2012; Zhang et al., 2014). Yet, most of the studies on budget optimization paid limited attention to the functionalities of current ad platforms and their budget account structure (Yang et al., 2014). Despite their intrinsic relationships, prior research mostly treated keyword selection and budget allocation issues as standalone problems.
Keyword Selection and Advertising Performance
Section titled “Keyword Selection and Advertising Performance”Advertisers can select keywords using a variety of keyword suggestion tools (Chen, 2010, Scholza, Brenner, and Hinz, 2019; Zhang, Zhang, and Chen, 2021). Nevertheless, the identification and selection of high utility keywords for a specific marketing goal is a non-trivial problem (Li, Pan, & Wang, 2010; Lu & Yang, 2017). For example, Ji, Rui, and Hansheng (2010) empirically examined a set of keywords using characteristics such as keyword length, rank, and click-through rate (CTR) to predict the identification of high potential candidate keywords and generate additional, more relevant keywords.
Although there are various ways to group keywords and their characteristics (Broder, 2002; Du et. al, 2017; Ghose & Yang, 2009; Li & Yang, 2020; Lu & Zhao, 2014), the buying funnel model (Jansen & Schuster, 2011) provides a theoretically relevant framework to bring together issues related to campaign strategies, keyword categorization, budget utilization, and ad performance. This is primarily due to the well-defined stages of the model (i.e., Awareness, Research, Decision, and Purchase) and the ability to capture consumer behavior associated with each stage of the model using various performance metrics (e.g., impressions, clicks, cost-per-click, conversions). In addition, Jansen and Schuster (2011) empirically demonstrated that the stages of the funnel exist in sponsored search and have statistically significant variations across all stages and performance metrics. With minor variations in the marketing literature (Caspari, 2004), the buying funnel represents a staged process for describing the way consumers make their buying decisions, starting from awareness of the existence of a need to the final purchase stage of a product or service (Jansen & Schuster, 2011). Their empirical results suggest that the buying funnel stages can provide a more flexible framework for advertisers to develop campaign priorities and define keyword segments that serve their market and product context.
Budget Allocation and Optimization
Section titled “Budget Allocation and Optimization”Despite being the most crucial of keyword advertising decisions, budget allocation has received limited attention in the literature. Keyword advertisers must determine the maximum daily budget, the keywords to bid on, and the maximum they are willing to bid on each. As a result, the budget allocation problem has been mostly investigated as part of decisions where budget is defined as a constraint (Kitts & LeBlanc, 2004; Zhao et. al, 2018). Other related studies have looked at optimizing the allocation of a budget across keywords using bid price settings (Chaitanya & Narahari, 2012; Cholette, Özlük, & Parlar, 2012; Dayanik & Parlar, 2013; Özlük & Cholette, 2007; Tunuguntla et. al, 2019); jointly optimizing bid price settings and campaign budget (Yang et al., 2012; Zhang et al., 2014); and optimizing budget allocation over several campaigns while considering substitution and complementarity effects (Yang et al., 2014).
Marketing Frameworks
Section titled “Marketing Frameworks”There are a number of strategic marketing frameworks that provide firms with meaningful ways to plan their marketing initiatives. Due to the shift in marketing strategies towards Internet and social media product promotion, understanding a user’s search behaviour and purchase intent is becoming increasingly important (Broder, 2002; Chalil, Dahana, and Baumann, 2020; Jain, Rakesh, and Chaturvedi, 2018). This study is particularly motivated by prior empirical research on consumer search behavior that provides the basis for keyword categorization, resource allocation, and performance improvement. These frameworks include the taxonomy of search user intent (Broder, 2002; Jansen, Booth, & Spink, 2008), spillover effects from generic to branded search (Nottorf & Funk, 2013), and more importantly, the buying funnel model that is empirically tested by Jansen and Schuster (2011).
Taxonomy of Search User Intent
Section titled “Taxonomy of Search User Intent”The literature on the classification of keywords is focused on either the user or the advertiser. The bulk of the literature to date has been conducted on the former. One of the early taxonomies used for classification of search user intent was introduced by Broder (2002). It includes three categories: Informational, Navigational, and Transactional. In the Informational category, the user is finding information expected to be present on Web pages; in the Navigational category, the user is interested in reaching a particular site; and in the Transactional category, the user intends to further engage with the internet by shopping or accessing additional web-enabled tools.
To further refine the definitions and classification of user intent using these categories, Jansen, Booth, and Spink (2008) derived additional attributes for each. In addition, they manually classify a random sample of 400 search queries and develop an algorithm for automatic classification of web queries. This taxonomy and the operationalized definitions offer additional value to an advertiser by providing a basic structure of how users are querying search engines. Furthermore, this ontology can be directly applied to an existing search advertising campaign to pursue specific objectives. However, operationalizing this taxonomy in the sponsored search domain may not be easy, due to the lack of focus on understanding the commercial intent of a search user (e.g., purchase a product or sign up for a service). Ashkan and Clarke (2013) also developed the classification of search user intent further by developing a subcategory called commercial intent and incorporating transactional queries as either navigational or informational. While this study provides additional context to classify users across keywords, it does not provide further insights beyond identifying keywords with commercial intent.
Bridging the gap between the search user intent taxonomy and its commercial extension is the work of Rutz and Bucklin (2011). Using a dynamic linear model with Bayesian estimation, they showed that there is a positive and asymmetric advertising effect from generic to branded terms. Utilizing two latent constructs, namely, awareness from impressions and awareness from clicks, Nottorf and Funk (2013) proposed an extended model that accounts for generic impressions and clicks, in addition to the carryover and spillover effects of previous searches with their respective parameters. Similarly, Lu and Zhao (2014) categorized keywords into three categories: general, specific, and “other” (or irrelevant). General and specific categories reflect the stages of the shopping goals theory as defined by Lee and Ariely (2006). The researchers argue that general keywords are used more by consumers in the early stage without shopping goals, and that specific keywords are used by those in the later stages with more concrete shopping goals. All these studies provide a lens to understand how consumers interact with search engines. However, despite statistical validation, the underlying empirical models do not provide a comprehensive classification of keywords and descriptions to guide decisions and actions in different marketing contexts.
The Buying Funnel Model
Section titled “The Buying Funnel Model”The buying funnel is a popular marketing paradigm that is commonly utilized in search marketing initiatives (Jansen & Schuster, 2011). Sometimes referred to as the buying cycle or sales funnel (Caspari, 2004), it is considered to be a more comprehensive, sequential process consumers follow when making a purchase (Ramos & Cota, 2008), similar to the progression in the shopping goals theory (Lu & Zhao, 2014). It is a relatively simple yet powerful model of how consumers behave when interacting with advertisements. The buying funnel is also closely related to traditional models such as the marketing funnel (Howard & Sheth, 1969; Young, Weiss, & Stewart, 2006), AIDA model (Lancaster & Withey, 2006) and hierarchy of effects model (Lavidge & Steiner, 1961). Jansen and Schuster (2011) also emphasize that the buying funnel is founded on information processing theory and consumer behaviour models (Bettman et al., 1998). Indicating minor variations in the marketing literature, Jansen and Schuster (2011) describe the buying funnel model as a four-stage model, which includes the stages of awareness, research, decision, and purchase. According to their descriptions, awareness refers to a consumer noticing a product or service that will satisfy a need or desire, followed by a research stage in which the consumer actively seeks out additional information related to the product type before making a decision. In the decision stage, the consumer decides among different brands of a specific product by forming a choice set before making a purchase in the final stage. In the purchase stage, the consumer knows what product and brand to purchase, but conducts a price or bundle comparison prior to making a purchase.
Based on the above description, Jansen and Schuster (2011) classified keywords into the buying funnel and empirically validated that each stage does in fact exist. While each stage is statistically different by all measures of performance, they noted that consumers may choose to purchase at any stage of the funnel. This phenomenon is also noted in Lu and Zhao’s (2014) study and may be explained by indirect sales from general keywords. Nevertheless, their classification scheme and the results of their analysis provide the motivation and theoretical foundation for this study, due primarily to the flexibility of the framework in applying the stages of the buying funnel to an advertiser’s unique market and product context. These results are also in line with the results of Nottorf and Funk’s (2013) study of spillover effects from generic to branded searches, where they suggested that, depending on industry and product type, it is in the advertiser’s interest to look into broader terms as keyword choices. In summary, the buying funnel model broadly captures the spillover effect or progression of consumers into different stages of purchase intent. In addition, the model is applicable to any advertiser in a B2B or B2C context. Considering its comprehensive classification scheme and popularity in practice, we employ the buying funnel model in this study as the underlying theoretical framework for keyword segmentation and campaign organization.
Simulation Model Development
Section titled “Simulation Model Development”Search advertising is a complex process where advertisers select keywords, create multiple ad campaigns and ad groups, and submit bids based on their maximum cost-per-click (willingness to pay) for keywords in their accounts. The auction process is dynamic throughout the day and the CPC (cost-per-click) charged and the resulting ad positions may vary from time to time (i.e., auction to auction). Therefore, simulation modelling is an appropriate method for achieving the research goal for several reasons. First, simulation modelling provides the analyst with the ability to recreate phenomenon and behaviour of interest for study (in this case, the sponsored search program of a single advertiser). Second, simulation provides the flexibility to analyse multiple scenarios over time (i.e., different allocation strategies). Third, simulation allows for the generation of results that can be statistically validated through multiple runs and testing.
The budget allocation is formulated at the search network level (e.g., AdWords account), where the objective is to determine how the network level budget is allocated to multiple ad campaigns. Multiple performance measures from the literature and industry practice are incorporated in the model. The simulation model is constructed under four budget allocation scenarios, including a baseline strategy. To capture the dynamics of the keyword advertising process, the simulation model is tested using historical keyword data obtained from Spyfu.com (www.spyfu.com), a leading provider of keyword research technology and competitive intelligence for search engine advertisers (Ayanso and Karimi, 2015). The daily search volume, Cost-Per-Click (CPC), and the positions of ads are projected based on this historical data.
The notation used in the simulation model is shown in Table 1. We consider a single advertiser with m campaigns and nj keywords for each campaign j , where each campaign is defined as one of the four buying funnel segments for simplicity (i.e., m = 4). Each campaign j contains specific keywords from a stage of the buying funnel model; 1 represents Awareness, 2 Research, 3 Decision, and 4 Purchase. Furthermore, each campaign is defined to represent a single ad group. Thus, the budget hierarchy is defined from an account level to a campaign level and from a campaign level to individual keywords.
Table 1. Notation
| Parameter | Description |
|---|---|
| j | Campaign identifier, where for campaigns |
| i | Keyword identifier in campaign , where for keywords of campaign |
| k | Allocation strategy identifier, where for strategies |
| Total advertising budget set for time period t | |
| Advertising budget amount allocated to campaign using allocation strategy during time period , where | |
| The allocation proportion calculated for campaign using allocation strategy during time period , where | |
| A random variable representing the number of searches of keyword from campaign during time period | |
| A random variable representing the cost-per-click of keyword from campaign during time period | |
| A random variable representing the ad position of keyword from campaign during time period | |
| Click-through-rate of keyword from campaign during time period , dependent on position | |
| Cost of Keyword in Campaign for time | |
| Number of clicks for Keyword in Campaign for time |
The company’s daily budget ( ) is allocated to the campaigns using four allocation strategies as depicted in Table 3 (note that the model is generalizable to any number of campaigns). In addition, the time period t can be set at any level of granularity, such as a week, a day, or an hour. Considering the current state of search advertising platforms, advertisers typically set a daily budget on a monthly basis and are limited in the number of times budgets can be adjusted during a day. Following this practice, t represents a day and the simulation model is run for a planning horizon of 30 days (one month). This is illustrated in Table 2 in a 4 x 4 grid where each column represents an allocation strategy and each row represents a campaign. For each column, the row total represents the account level budget ( ). Figure 1 also captures the conceptual design of the simulation model.
Table 2. Campaigns and budget allocation strategies
| Jico | UDGET ALLOCATED ALLOCATION STRATEGY | ,2,3,4; | during time period , | |
|---|---|---|---|---|
| CAMPAIGN | Baseline | k=2 | k=3 | Clicks-based |
| C1: AWARENESS (CAMPAIGN ONE) | C1 | C1 | C1 | C1 |
| BUDGET ($) | BUDGET ($) | BUDGET ($) | BUDGET ($) | |
| using | using | using | using | |
| BASELINE | COST | VOLUME | CLICKS | |
| C2: RESEARCH (CAMPAIGN TWO) | C2 | C2 | C2 | C2 |
| BUDGET ($) | BUDGET ($) | BUDGET ($) | BUDGET ($) | |
| using | using | using | using | |
| BASELINE | COST | VOLUME | CLICKS | |
| C3: DECISION (CAMPAIGN THREE) | C3 | C3 | C3 | C3 |
| BUDGET ($) | BUDGET ($) | BUDGET ($) | BUDGET ($) | |
| using | using | using | using | |
| BASELINE | COST | VOLUME | CLICKS | |
| C4: PURCHASE (CAMPAIGN FOUR) | C4 BUDGET ($) using BASELINE | C4 BUDGET ($) using COST | C4 BUDGET ($) using VOLUME | C4 BUDGET ($) using CLICKS |
The amount of a budget allocated to campaign j during time period t using a given allocation strategy k, , is shown in (1). This equals the allocation proportion ( ) multiplied by the total account level budget ( ). The allocation proportion ( ) represents the ratio of a campaign’s total outcome of volume, cost, or clicks to the corresponding total outcome at the account level from time period t-1.
C_{_{jkt}} = \lambda_{_{jkt}} * B_{_t} \text{, for } j = 1, 2, 3, 4 \text{; } k = 1, 2, 3, 4 \text{; and } t = 1, 2, ..., 30 \tag{1}
The allocation proportion for each strategy is given as follows:
Baseline allocation strategy
Figure 1. Conceptual design of the simulation model
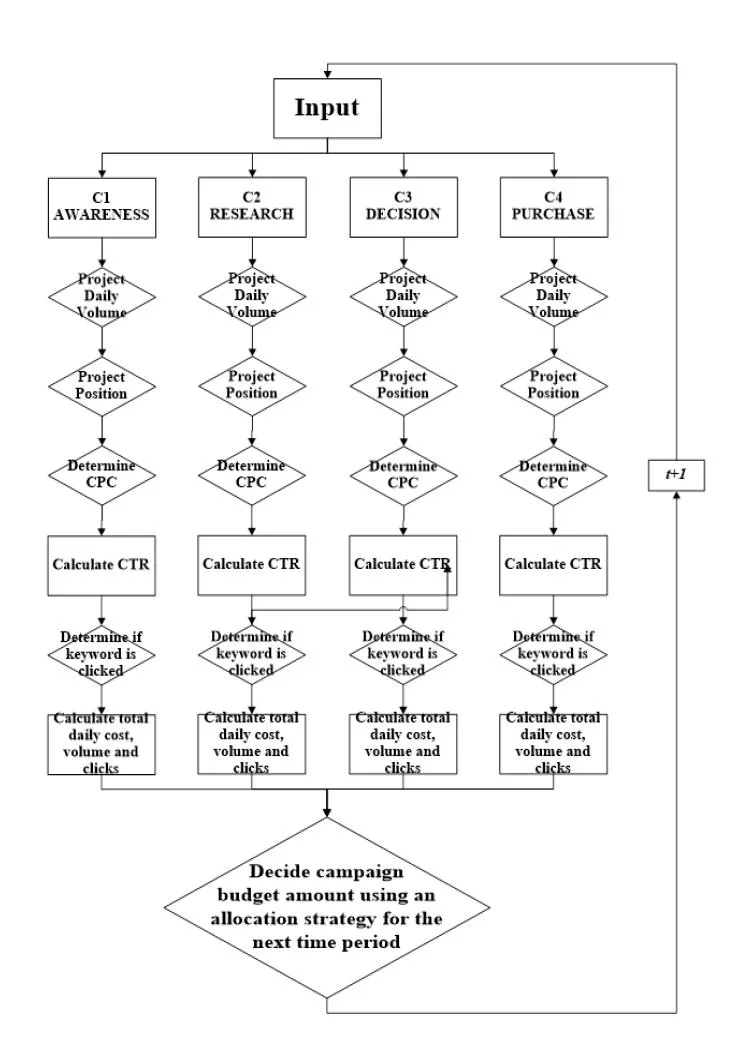
The search volume, position, and CPC of each keyword are sampled from a Triangular distribution, with minimum, most likely, and maximum values from the SpyFu data. The Triangular distribution is conceptually simple and suitable in the absence of perfect information about the distributions of random variables because the information requirement to generate it includes the minimum, most likely and maximum values of a random variable (Ayanso, Diaby, & Nair, 2006). The input parameters specifically used for search volume are based on a minimum of one and most likely and maximum values of the “exact global daily search volumes” for each keyword from the SpyFu data. The position of a keyword is determined using the theoretical minimum position of one as the minimum and most
likely and maximum positions based on the historical average position and the number of competing advertisers, respectively. To determine CPC, the “broad cost-per-click”, “phrase cost-per-click” and “exact cost-per-click” values are ordered from lowest to highest and used to represent minimum, most likely, and maximum values in the triangular distribution. According to previous empirical studies, the top ranked position generates the largest CTR. The CTR for positions below the first position decreases in value (Ghose & Yang, 2009). Considering this, and to capture the decay in clicks as position increases, is formulated using the Zipf distribution (Naldi et al., 2010). This is given in (2) and represents the probability that a user clicks the ad of keyword i from campaign j during time period t. The value of represents the degree of decay on the click-through-rate (CTR) when the position of the ad drops from top to bottom (i.e., the higher the value of , the faster the decay; values randomly drawn between 1 and 2 are used in the experiments).
CTR_{ijt} = \frac{1}{\left(POS_{ijt}\right)^{\alpha}} \tag{2}
The performance implications of each allocation strategy are assessed based on two direct measures, budget overage/underage, , and budget absolute deviation, . These are given in (3) and (4), respectively.
, for ; ; and (3)
, for ; ; and (4)
The budget overage/underage is evaluated at the campaign level. According to keyword auction rules, once the daily budget runs out, ads are not shown for the remainder of the day. Thus, advertisers miss opportunities due to the shortage of budget and would be a negative value. Alternatively, if the daily budget is left unutilized, it represents poor budget allocation or ineffective campaign or keyword performance, and would be a positive value. In particular, poor allocation is characterized by overage in some campaigns and underage in other campaigns. We track this performance for each allocation strategy. Depending on the specific objective of the firm, other optimization-oriented metrics (e.g., profit-based or revenue-based) can be easily integrated in the simulation model. However, the main goal in this research is to assess the drivers of the allocation strategy (i.e., cost, volume, or clicks) with respect to the subsequent utilization of the allocated budget.
To show the relative efficiency of each allocation strategy, we also calculate the percent overage/underage of each campaign at the end of each time period. The overall efficiency of strategy k and campaign j for all 30 days is calculated by taking the average of the percent overage/underage across the planning horizon. To assess the variance in dollars from the allocated budgets at the campaign level, we calculate the absolute value of the overage/underage for each campaign under each allocation strategy, as shown in (4). Furthermore, to assess each allocation strategy across the duration of the planning horizon (i.e., 30 days), the average of the absolute values of the deviations for 30 days is reported. Furthermore, taking the sum of the average absolute deviations from all campaigns, the total overage/underage across the entire account is computed to compare the overall efficiency of each allocation strategy.
Experimental Setting
Section titled “Experimental Setting”Before selecting the samples, keyword advertising data from 76 companies across 16 industries was first collected. The files obtained for each company contain a domain’s keywords, the URL it is linked to, its position, exact local and exact global daily searches, broad, phrase, and exact cost per click, clicks per day, and cost per day. Google provides three different keyword match types for advertisers (Yang, Pancras, and Song, 2021). These are “Broad”, “Phrase”, and “Exact”. “Broad” is the default setting in AdWords with the widest casting net and “Exact” is the most specific with the smallest casting net. Each match type has an impact on the number of similar keywords and average CPC due to differences in CPCs for every variation of a keyword. Table 3 shows descriptions of each match type used in this study with examples.
Table 3. Match type descriptions according to Google
| Match type | Special symbol | Example keyword | Ads may show on searches that | Example searches |
|---|---|---|---|---|
| Broad match | none | women’s hats | include misspellings, synonyms, related searches, and other relevant variations | buy ladies hats |
| Broad match modifier | +keyword | +women’s +hats | contain the modified term (or close variations, but not synonyms), in any order | hats for women |
| Phrase match | ”keyword" | "women’s hats” | are a phrase, and close variations of that phrase | buy women’s hats |
| Exact match | [keyword] | [women’s hats] | are an exact term and close variations of that exact term | women’s hats |
| Negative match | -keyword | -women | are searches without the term | baseball hats |
Data Pre-processing and Sampling
Section titled “Data Pre-processing and Sampling”The keyword advertising data was initially pre-processed to remove data quality issues. Once the records were segmented into the buying funnel, the distributions of global exact volume and broad cost-per-click were visualized by segment for further examination. To examine the profiles of the companies within each industry, the top five companies in terms of market share from each of the 16 industries were selected, if they were found to be actively advertising on Google’s AdWords platform. Following this, four industries were selected to represent the final sample as cases. These industries were selected based on their distinct product/service offerings, relevance to searchers (most searchers are likely to have purchased from one, if not all), and the diversity of advertising goal orientations as defined by the buying funnel. These four industries are Airlines, Computer Hardware, Department Stores, and Life Insurance. For example, prior work has investigated insurance keywords (Goldfarb & Tucker, 2011b) and has shown that the keywords are mostly in the “awareness” and “research” categories of the buying funnel. Computer hardware was chosen because of the high possibility of “decision” and “purchase” oriented keywords related to specific product model names and numbers and the high volume of cross-product or cross-model comparisons. Department stores were chosen because of the broad selection of products they carry and their large brick and mortar presence. Additionally, given the amount and variety of products department stores carry (from convenience goods to luxury), their keyword portfolios are in alignment with the buying funnel. Finally, the airlines industry was chosen because most sales occur online and high level of competition is expected depending on the markets or locations.
The top company by market share is selected from each of the four industries. These companies are Lenovo from the Computer and Hardware industry, Macy’s from Department Store industry, Prudential from the Life Insurance industry, and United Airlines from the Airline industry. Although these companies have top market share and financial performance, they are not necessarily top performers in search advertising. However, these companies provide richer keyword data pool to demonstrate the proposed budget allocation strategies. Being the top performing companies in their industries financially, their competitors would try to emulate similar business and marketing strategies, manufacture or sell similar products, and therefore bid on subsets of similar keywords. This competition provides a more appropriate setting for comparisons and further data analyses. For each company, a random sample of 1000 keywords were selected and classified into the buying funnel model using the keyword classification schema proposed by Jansen and Schuster’s (2011). Example keywords by each stage of the buying funnel are shown in Table 5 for each of the four companies. Table 4 presents the descriptive statistics of the keyword data for the four companies illustrated. A summary of the input data and the final count results of the classification by stage are also shown in Figure 2 (a)-(d), where each campaign represents a stage of the buying funnel. The campaigns are ordered sequentially according to the stages of the buying funnel. C1 represents “awareness” keywords, C2, “research”, C3, “decision”, and C4, “purchase” keywords.
Table 4. Descriptive statistics
| LENOVO | VOLUME | POSITION | MIN CPC | EXP. CPC | MAX CPC |
|---|---|---|---|---|---|
| Mean | 18.71 | 5.19 | 1.03 | 1.73 | 2.91 |
| Std Dev. | 38.42 | 4.31 | 1.11 | 1.66 | 2.99 |
| Minimum | 1.00 | 1.00 | 0.01 | 0.01 | 0.02 |
| Maximum | 330.00 | 21.00 | 6.48 | 12.00 | 36.54 |
| MACY’S | |||||
| Mean | 11.93 | 6.70 | 0.58 | 0.97 | 1.50 |
| Std Dev. | 28.23 | 4.96 | 0.53 | 0.85 | 1.38 |
| Minimum | 1.00 | 1.00 | 0.01 | 0.01 | 0.02 |
| Maximum | 330.00 | 22.00 | 3.92 | 12.11 | 15.59 |
| PRUDENTIAL | |||||
| Mean | 7.93 | 8.20 | 5.33 | 8.49 | 12.87 |
| Std Dev. | 18.44 | 5.91 | 6.45 | 9.00 | 12.96 |
| Minimum | 1.00 | 1.00 | 0.01 | 0.01 | 0.03 |
| Maximum | 270.00 | 22.00 | 35.74 | 93.96 | 122.53 |
| UNITED | |||||
| Mean | 7.51 | 7.53 | 0.95 | 1.55 | 2.67 |
| Std Dev. | 11.59 | 5.60 | 0.88 | 1.28 | 2.87 |
| Minimum | 1.00 | 1.00 | 0.01 | 0.01 | 0.02 |
| Maximum | 63.00 | 22.00 | 8.83 | 12.53 | 42.72 |
Table 5. Examples of keywords classified according to the buying funnel
| LENOVO | |||
|---|---|---|---|
| AWARENESS | RESEARCH | DECISION | PURCHASE |
| laptops sale | discount laptops for students | battery lenovo | lenovo ideapad y530 battery |
| labtop | thin laptop computers | thinkpad x series | lenovo thinkpad x120e |
| laptop best | best high performance laptops | lenovo charger | lenovo ac adapter 65w 20v |
| MACY’S | |||
| AWARENESS | RESEARCH | DECISION | PURCHASE |
| elegant plates | top rated rice cooker | melior coffee press | krups b100 beertender |
| men gold watch | 24k gold watch | mens diesel watch | bulova men s marine star watch |
| cologne fragrance | best deodorant and antiperspirant for women | mori perfume | christian dior addict |
| PRUDENTIAL | |||
| AWARENESS | RESEARCH | DECISION | PURCHASE |
| 401 retirement | 401k direct rollover | prudential investment | bank of america wealth management banking |
| whats an annuity | pension and annuity income | ing annuties | the hartford variable annuity |
| life insurance search | affordable term life | life insurance fidelity | suze orman whole life insurance |
| UNITED | |||
| AWARENESS | RESEARCH | DECISION | PURCHASE |
| fly to florida | cheap florida airfare | disney florida package | disney world orlando florida tickets |
| is travel to cancun safe | cheap flight to cancun | barcelo los cabos resort | riu caribe all inclusive cancun |
| one way airline ticket | airfares hawaii | hawaiian airlines international flights | hawaiian airline reservation |
With the exception of Prudential, where there are more “research” keywords than any other, each company’s number of keywords follows the funnel shape. This means, most keywords are “awareness”, and the number of keywords diminish from “awareness” to “research”, “research” to “decision”, and from “decision” to “purchase”. Nevertheless, the funnel shapes are not identical. Macy’s has a near perfect funnel shape. Lenovo’s funnel is the second most balanced with over one third of the keywords in the latter stages of the funnel and a similar number of “research” and “decision” keywords. United has a heavily skewed funnel with 96 percent of the keywords belonging to either “awareness” (57%) or “research” (39%).
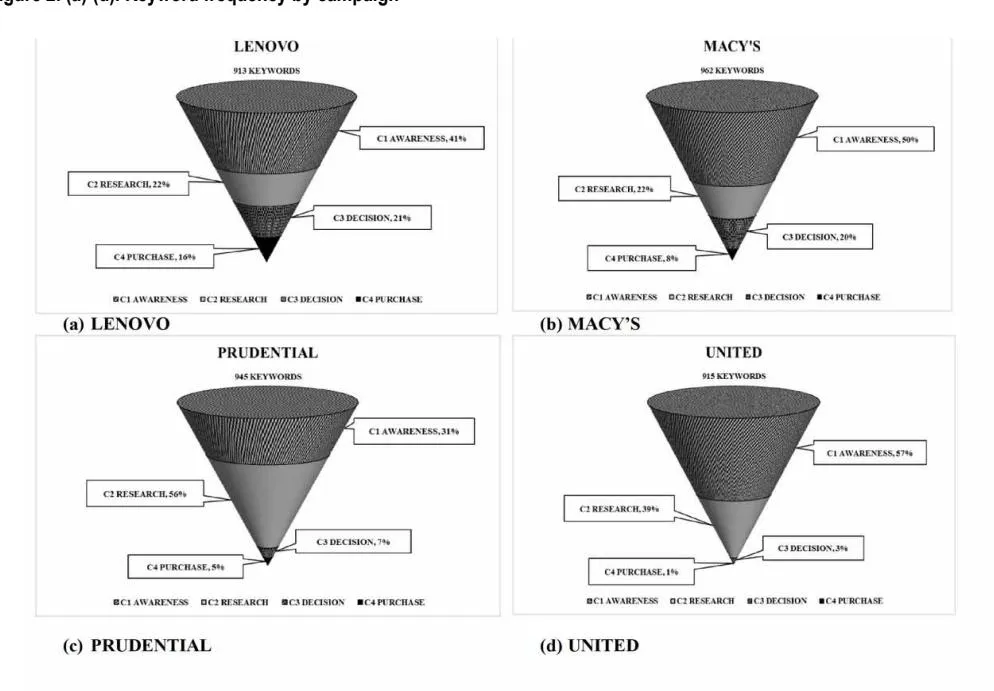
Figure 2. (a)-(d). Keyword frequency by campaign
Performance Measures
Section titled “Performance Measures”Four simulation experiments are conducted, one for each company. Prior to the experiments, the companies’ keywords were segmented into four campaigns, each campaign aligning with a stage of the buying funnel. To evaluate the performance of the allocation strategies, comparison is made with a Baseline strategy, which is an equal-spread allocation strategy also used in prior studies as a baseline (Yang et al., 2012; Zhang et al., 2012; Zhang et al., 2014). The three strategies evaluated include Cost-based, Volume-Based, and Clicks-based, where the current period’s allocation is based on a campaign’s cost, volume, and clicks in proportion to the total cost, volume, and clicks during the previous time period, respectively. For each allocation strategy, the actual cost spent against the allocated budget is tracked and the budget overage/underage is computed for each campaign during each time period. Corresponding results in percent overage/underage are also reported. For each campaign, an average value is computed for a 30-day planning horizon. To evaluate the overall performance of each allocation strategy, the sum of the average absolute overage/underage values of the four campaigns is computed, which is then compared to the Baseline. A lower dollar value (closer to zero) indicates more efficient overall budget utilization.
Simulation Results
Section titled “Simulation Results”The simulation model is implemented using Arena Simulation Software, one of the most commonly used simulation tools for discrete event modeling in various domains. The simulation is conducted over a 30-day period with 100 replications for each scenario. The final number of replications was chosen based on the robustness of preliminary results and the computational demand. For each company, the profile of the campaigns in terms of total cost, volume, clicks, and the number of keywords is presented in Figure 3(a)-(d). Furthermore, the average absolute deviation by allocation strategy and the average percentage of overage/underage by campaign are shown in Figure 4(a)-(d) and Figures 5(a)-(d), respectively.
Figure 3. (a)-(d). Share of cost, volume, clicks and keywords by campaign
Figure 3(a) presents the share of each segment (campaign) for Lenovo’s total cost, volume, clicks, and number of keywords. As shown, the percentages for cost, volume, and clicks do not match the percentage of keywords for each campaign. This is due to the varying CPCs and average positions of the campaigns. Lenovo’s “decision” and “purchase” keywords combined represent only 37 percent of all keywords, but generate a combined 56 percent of clicks. This is caused by Lenovo’s lower average CPCs and ad positions in these two segments. This is in contrast to “awareness” keywords, which represent 41 percent of the keywords and 50 percent of the cost, but generate only 37 percent of the clicks. “Research” keywords are the smallest contributors to total clicks (only 6%). This is caused by higher average CPCs and ad positions, in addition to lower average volumes in this segment. For a click maximization strategy, Lenovo should invest more in “decision” and “purchase” keywords. Figure 3(b) presents the share of each campaign for Macy’s total cost, volume, clicks, and number of keywords, along with the corresponding totals. A key observation in the case of Macy’s is that “Awareness” keywords contribute the most across all measures. For Prudential, Figure 3(c) shows that the “awareness” keywords, while contributing 43 percent of the total cost, account for a higher percentage of total volume (53%) and total clicks (58%). On the other hand, the “decision” and “purchase” keywords contribute far less than “awareness” and “research” keywords across all measures. Prudential has invested heavily in the number of “research” keywords (56%), but they only provide 28 percent of total clicks and contribute the largest portion of the cost (44%). For United, Figure 3(d) shows that “decision” and “purchase” keywords contribute the least to all the measures. On the other hand, “awareness” keywords contribute the largest, followed by “research” keywords.
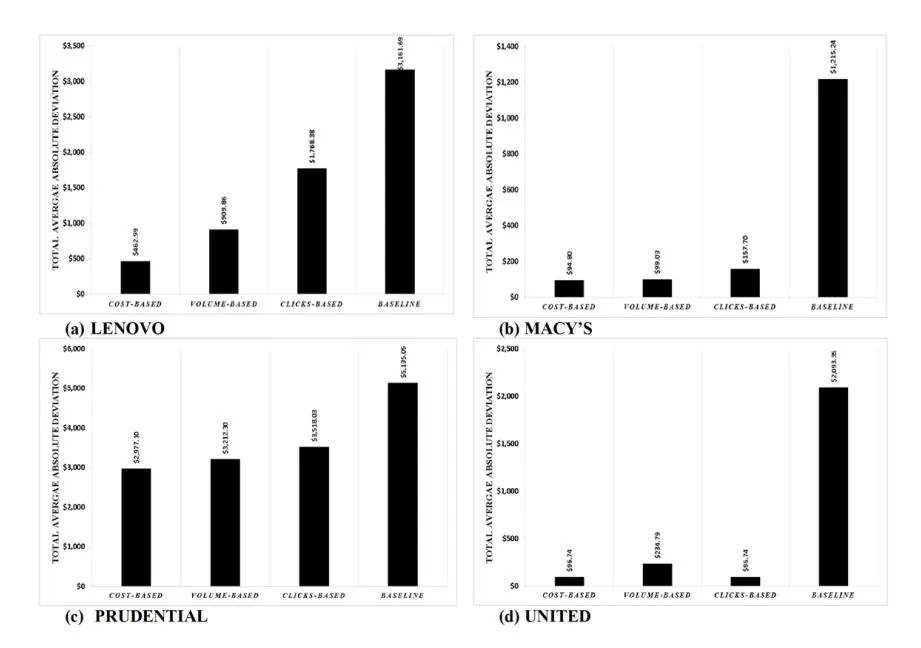
Figure 4. (a)-(d). Total budget deviation in dollars ($)
Lenovo’s total average absolute deviation for all four strategies is shown in Figure 4(a). The figure shows that all allocation strategies significantly outperform the Baseline. The Cost-based strategy performed the best overall and is nearly seven times better than the Baseline. The Clicksbased strategy performed the poorest of all the proposed strategies, but it is still twice as efficient as the Baseline. Figure 4(b), 4(c) and 4(d) similarly show that the proposed Cost-based, Volume-based, and Clicks-based strategies performed substantially better than the Baseline strategy for Macy’s, Prudential, and United, respectively.
Figure 5 (a)-(d) shows the average percent overage/underage by campaign. In the case of Lenovo, Figure 5(a) shows that the Cost-based strategy performed the best in allocating the funds across all campaigns. This is followed by the Volume-based strategy. On the other hand, the Clicks-based strategy did not perform well consistently. Macy’s average percent overage/underage by campaign is also shown in Figure 5(b). In all cases, the proposed allocation strategies outperformed the Baseline. Using the Cost-based allocation strategy, there is an over-allocation of only about 6% across the four campaigns. The Volume-based strategy performs better in “awareness” and “decision” campaigns (i.e., the “awareness” segment has an over-allocation of only 3%, and the “decision” segment has an under-allocation of only 1%). However, the performance gets slightly worse in “research” (22% over-allocation) and “purchase” (33% over-allocation). On average, the Cost-based strategy shows the lowest percent of budget misallocation across the four segments. Prudential’s average percent overage/underage by campaign is shown in Figure 5(c). By using the Cost-based allocation strategy, the budget is consistently about 29% higher. The Volume-based strategy resulted in a shortage of budget for “purchase” keywords. This is due to relatively higher CPCs of the “purchase” keywords. Though the Baseline strategy outperforms all proposed allocation strategies on “awareness” keywords and shows better performance than the Cost-based strategy on “research” keywords, it is significantly over-budgeted for the “decision” and “purchase” keywords. From the proposed allocation strategies, the Clicks-based strategy shows the worst performance for “awareness” and “decision” keywords. Finally, United’s average percent overage/underage by campaign is shown in Figure 5(d). As shown, the Baseline strategy is outperformed in all campaigns, except for research keywords. The Baseline strategy led to an overage of more than 200% on “awareness” keywords and left 95 percent of “decision”, and 97 percent of “purchase” campaigns’ under-budgeted.
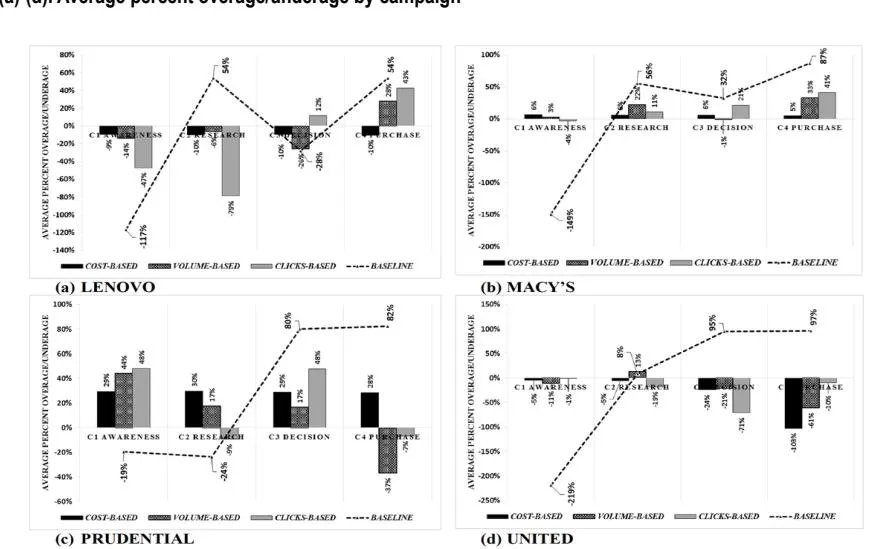
Figure 5 (a)-(d). Average percent overage/underage by campaign
In order to assess the overall statistical significance of the simulation results, paired differences are conducted using t-tests, comparing the total budget deviation under each of the proposed allocation strategies to that of the Baseline strategy. The tests are run using 3000 observations from 100 replications of 30 days. The test results are shown in Table 6 showing the paired differences for each company (Cost - Baseline; Volume - Baseline; Clicks - Baseline). The statistical test results at 0.01 significance level clearly show that each of the proposed budget allocation heuristics significantly outperform the Baseline strategy for all companies studied (i.e., negative values of the mean on the paired differences). Therefore, the use of any of these allocation strategies, along with the segmentation of keywords as well as campaign organization into the buying funnel framework, improves advertiser’s overall budget utilization.
Discussion and Implications
Section titled “Discussion and Implications”The results of the simulation experiments show that all the proposed budget allocation strategies consistently outperform the Baseline strategy. Table 7 summarizes our case findings and their potential implications for other companies. Overall, the Cost-based allocation strategy performs the best in all cases. The implication of this is that using historical expenditure clearly reduces an advertiser’s lost opportunity and inefficiency in budget utilization. The Cost-based heuristic, as it is an approach that is directly related to actual spending, is more informative and adaptive to the changes in the spending patterns of each campaign. While the sample cases studied in this research may not represent all advertisers, it is important to highlight the flexibility these allocation strategies offer to different companies, depending on the industry they compete in, their broader marketing strategy, and their product/service offerings. While the Cost-based strategy shows consistent performance across the cases examined, it should be noted that it does not consistently outperform the other strategies in each campaign. Therefore, the proposed budget allocation strategies can be leveraged more effectively in sync with the campaign organization and keyword categorization frameworks. For example, as a department store with a vast array of products varying in consumer purchase involvement and intensity, Macy’s investment in keywords follows the shape of the buying funnel. Considering that the majority of the products Macy’s carries are low involvement purchases, such as clothing and accessories, its focus on awareness marketing will lead to a good return. The purpose is to create product awareness for searchers and subsequently cross-sell and up-sell products once customers are on its website. This is shown by the dominant contribution of the “awareness” keywords to total cost, clicks, and volume. Macy’s can maximize awareness with a focus on volume for both online and offline channels and facilitate cross-channel promotions and sales (i.e., up-selling and cross-selling).
Table 6. Statistical comparisons of proposed allocation strategies with the Baseline
| Paired Differences | ||||||
|---|---|---|---|---|---|---|
| LENEVO | Mean | St. Dev. | St. Error Mean | t | df | Sig. (2-tailed)* |
| Cost-Baseline | -2598.72 | 177.48 | 3.24 | -801.98 | 2999 | 0.00 |
| Volume-Baseline | -2225.44 | 126.20 | 2.30 | -965.90 | 2999 | 0.00 |
| Clicks-Baseline | -1387.70 | 295.63 | 5.40 | -257.10 | 2999 | 0.00 |
| MACY’S | ||||||
| Cost-Baseline | -1088.90 | 104.60 | 1.91 | -570.17 | 2999 | 0.00 |
| Volume-Baseline | -1075.62 | 89.43 | 1.63 | -658.77 | 2999 | 0.00 |
| Clicks-Baseline | -1029.96 | 63.51 | 1.16 | -888.23 | 2999 | 0.00 |
| PRUDENTIAL | ||||||
| Cost-Baseline | -2161.94 | 736.40 | 13.45 | -160.80 | 2999 | 0.00 |
| Volume-Baseline | -1924.72 | 746.98 | 13.64 | -141.13 | 2999 | 0.00 |
| Clicks-Baseline | -1511.25 | 685.86 | 12.52 | -120.69 | 2999 | 0.00 |
| UNITED | ||||||
| Cost-Baseline | -1933.04 | 90.76 | 1.66 | -1166.60 | 2999 | 0.00 |
| Volume-Baseline | -1851.90 | 56.03 | 1.02 | -1810.40 | 2999 | 0.00 |
| Clicks-Baseline | -1928.70 | 124.12 | 2.27 | -851.13 | 2999 | 0.00 |
| Sig. Level = 0.01; *Sig. p< 0.01 |
Table 7. Summary of case findings and implications
| Lenovo | Macys | Prudential | United | |
|---|---|---|---|---|
| Industry Profile | Computer Hardware § high tech and oligopolistic | Department Stores § Competitive and majority brick and mortar presence | Life Insurance § Highly competitive and a mixture of on and offline channels | Airlines § Highly competitive with many online booking outlets |
| Company Profile | § Well-established brand § Main products are laptops | § Vast array of products § large department store with heavy brick and mortar presence | § Many financial and life insurance products § Long term investments | § Airline tickets varying in price and price elasticity § Middle of the pack service |
| Product Life Cycle | § Expensive longer term purchase decisions § Products vary in life cycle § New models of laptops and tablets (sometimes entire product categories) introduced on an annual basis | § Variety of products with different life cycles and purchase intensity § Majority of products are low involvement purchases, such as, clothing and accessories | § Long term, high involvement purchase decisions | § Tickets can be purchase at virtually any period of time from months in advance. |
| Inferred Marketing Strategy and Focal Stages | Competitive and conversion based. Focused more on click maximization and consumer attention grabbing in the “decision” and “purchase” stages | Generate awareness (volume focus) for cross- selling opportunities | Generate awareness and convince consumers in the ”research” stage | Generate clicks and bookings through own reservation system |
| Implication | The inferred strategy of clicks and conversions is best attained using the Clicks-based allocation strategy, which allocates more to the “decision” and ”purchase” stages | The inferred strategy of awareness is best attained by both the Cost-based and Volume-based allocation strategies. | The inferred strategy of awareness is best attained by both the Cost-based and Volume-based allocation strategies. | The inferred strategy of clicks is in the early stages of “awareness” and “research” is best served by the Clicks based allocation strategy. |
| Suitable Allocation Strategy | In line with the goal of clicks and conversions, the Clicks-based strategy is more suitable to allocate budget to the “decision” and “purchase” stages | With a focus on awareness, the Volume-based allocation strategy is in line with the inferred marketing strategy | To create brand awareness, the Volume-based strategy is best suited to allocate sufficient budget for awareness” and “research” | With an emphasis on promoting its reservation system, the Clicks-based strategy is best suited to allocate budget to the focal stage of awareness |
Furthermore, while valuation based on conversions or clicks may seem logical as a performance measure to evaluate sponsored search outcomes, their sole pursuit may not apply to all advertisers when they are not attempting to sell a service or good, and instead may be simply seeking to increase awareness of an event or brand (Naldi et al., 2010). Jansen and Schuster (2011) acknowledged counterintuitive results in the flow of searchers from one cognitive stage to the next within their data, with more searches happening in the research stage and more revenue generated at the awareness stage. This may be due to the significant differences in how a shopper is provided information on a product when seeking online versus offline.
Specifically, search engine result pages and landing pages are information rich ad spaces.
As Goldfarb and Tucker (2011a) found, privacy plays a crucial role in the likelihood of a consumer clicking on an advertisement. Kim and Sundar (2010) found that relevance plays an important role in reducing negative perceptions of advertisements. Thus, in the case of Prudential, the highly personal nature of life insurance products limits the ability of advertisers to create effective, targeted, and highly relevant advertisements in the “decision” and “purchase” stages, except for generic products. Considering this, the Volume-based strategy provides more than sufficient budget in the lead generation stages (“awareness” and “research”) and even the “decision” stage. It registered shortage only in the “purchase” stage. Thus, our keyword classification and simulation results confirm that the buying funnel model is adaptable to different domains and capable of meaningfully segmenting keywords. Our results also reveal that sponsored search is largely used as a lead generation tool. Three of the four cases have 50 percent or more of the budget consumed in the “awareness” stage (Lenovo 50%, Macy’s 67%, and United 76%). Prudential also has 43 percent in “awareness” stage and 44 percent in “research” stage, indicating the overemphasis in the early stages of the funnel. This further implies that advertisers can effectively tailor their budget utilization by segmenting their keywords and organizing their campaigns according to their promotional goals.
Conclusion and Future Research
Section titled “Conclusion and Future Research”A simulation modelling approach is used to integrate the keyword segmentation, campaign organization and budget allocation decisions. The buying funnel model is employed as the underlying marketing framework to segment keywords and organize campaigns and analyze the implications of actual expenditures, search volumes, and ad clicks, as main drivers of sponsored search budget allocation decisions. The simulation model is constructed to align sponsored search initiatives with ad campaigns with specific objectives and improve the allocation of the daily advertising budget across these campaigns. Experiments with cases sampled from a large pool of companies from many industries, provide useful insights and implications of the proposed budget allocation strategies. The results show that the proposed allocation strategies consistently outperform the baseline strategy commonly used in practice. Our study demonstrates the benefits of segmenting keywords into the buying funnel as a means to identify and track specific promotional objectives and prioritize campaign level budget allocation decisions. The simulation outcomes demonstrate that the buying funnel framework is adaptable to various forms of account structure.
Due to the dynamic and complex nature of keyword auctions (Jafarzadeh, Abedin, Aurum, and D’Ambra, 2019), this study can be extended in several ways in future research. First, the simulation experiment can be extended with an active AdWords account to account for daily, weekly, and other cyclical trends and patterns that are typical in sponsored search (Gupta, Saha, & Sarkar, 2016; Im et al., 2019). This will allow for real-time data for quality scores and advertisements triggered by keywords. Furthermore, the problem of ad attribution and the estimation of value-per-click (VPC) could be added with details about advertisements and different contexts of landing pages. Overall, this extension could significantly improve the capabilities of the proposed approach and its practical validation. Future work can also extend the current study with other allocation strategies (e.g., combinations of the proposed heuristics). While this study uses the buying funnel model as the underlying marketing framework, there is also a growing body of literature on the segmentation of keywords (Ashkan & Clark, 2013; Broder, 2002; Lu & Zhao, 2014; Nottorf & Funk, 2013; Rutz & Bucklin, 2011). Future studies can compare the effectiveness of these other theoretical frameworks for similar purpose.
References
Section titled “References”Ashkan, A., & Clarke, C. L. (2013). Impact of query intent and search context on click-through behavior in sponsored search. Knowledge and Information Systems, 34(2), 425–452. doi:10.1007/s10115-012-0485-x
Ayanso, A., Diaby, M., & Nair, S. (2006). Inventory rationing via drop-shipping in Internet retailing: A sensitivity analysis. European Journal of Operational Research, 171(1), 135–152. doi:10.1016/j.ejor.2004.07.060
Ayanso, A., & Karimi, A. (2015). The moderating effects of keyword competition on the determinants of ad position in sponsored search advertising. Decision Support Systems, 70, 42–59. doi:10.1016/j.dss.2014.11.009
Ayanso, A., & Mokaya, B. (2013). Efficiency evaluation in search advertising. Decision Sciences, 44(5), 877–913. doi:10.1111/deci.12038
Bettman, J. R., Luce, M. F., & Payne, J. W. (1998). Constructive consumer choice processes. The Journal of Consumer Research, 25(3), 187–217. doi:10.1086/209535
Broder, A. (2002). A taxonomy of web search. ACM SIGIR Forum, 36(2), 3-10.
Caspari, P. (2004). Management dynamics. Wiley.
Chaitanya, N., & Narahari, Y. (2012). Optimal equilibrium bidding strategies for budget constrained bidders in sponsored search auctions. Operations Research, 12(3), 317–343. doi:10.1007/s12351-010-0097-8
Chalil, T. M., Dahana, W. D., & Baumann, C. (2020). How do search ads induce and accelerate conversion? The moderating role of transaction experience and organizational type. Journal of Business Research, 116, 324–336. doi:10.1016/j.jbusres.2020.05.033
Chen, L. (2010). Using a two-stage technique to design a keyword suggestion system. Information Research, 15(1).
Cholette, S., Özlük, Ö., & Parlar, M. (2012). Optimal keyword bids in search-based advertising with stochastic ad positions. Journal of Optimization Theory and Applications, 152(1), 225–244. doi:10.1007/s10957-011-9886-3
Dayanik, S., & Parlar, M. (2013). Dynamic bidding strategies in search-based advertising. Annals of Operations Research, 211(1), 103–136. doi:10.1007/s10479-013-1427-z
Dhar, V., & Ghose, A. (2010). Research commentary - Sponsored search and market efficiency. Information Systems Research, 21(4), 760–772. doi:10.1287/isre.1100.0315
Du, X., Su, M., Zhang, X., & Zheng, X. (2017). Bidding for multiple keywords in sponsored search advertising: Keyword categories and match types. Information Systems Research, 28(4), 681–886. doi:10.1287/isre.2017.0724
Ghose, A., & Yang, S. (2009). An empirical analysis of search engine advertising: Sponsored search in electronic markets. Management Science, 55(10), 1605–1622. doi:10.1287/mnsc.1090.1054
Goldfarb, A., & Tucker, C. (2011a). Online display advertising: Targeting and obtrusiveness. Marketing Science, 30(3), 389–404. doi:10.1287/mksc.1100.0583
Goldfarb, A., & Tucker, C. (2011b). Search engine advertising: Channel substitution when pricing ads to context. Management Science, 57(3), 458–470. doi:10.1287/mnsc.1100.1287
Gupta, A., Saha, B., & Sarkar, U. K. (2016). Systemic concentration in sponsored search markets: The role of time window in click-through-rate computation. ACM Transactions on Management Information Systems, 7(2), 6. Advance online publication. doi:10.1145/2934695
Howard, J. A., & Sheth, J. N. (1969). The theory of buyer behavior. Wiley.
Im, I., Dunn, B. K., Lee, D. I., Galletta, D. F., & Jeong, S.-O. (2019). Predicting the intent of sponsored search users: An exploratory user session-level analysis. Decision Support Systems, 121, 25–36. doi:10.1016/j. dss.2019.04.001
Jafarzadeh, H., Abedin, B., Aurum, A., & D’Ambra, J. (2019). Search Engine Advertising Perceived Effectiveness: A Resource-Based Approach on the Role of Advertisers’ Competencies. Journal of Organizational and End User Computing, 31(4), 46–73. doi:10.4018/JOEUC.2019100103
-
Jain, G., Rakesh, S., & Chaturvedi, K. R. (2018). Online Video Advertisements’ Effect on Purchase Intention: An Exploratory Study on Youth. International Journal of E-Business Research, 14(2), 87–101. doi:10.4018/ IJEBR.2018040106
-
Jansen, B. J., Booth, D. L., & Spink, A. (2008). Determining the informational, navigational, and transactional intent of Web queries. Information Processing & Management, 44(3), 1251–1266. doi:10.1016/j.ipm.2007.07.015
-
Jansen, B. J., & Mullen, T. (2008). Sponsored search: An overview of the concept, history, and technology. International Journal of Electronic Business, 6(2), 114–131. doi:10.1504/IJEB.2008.018068
-
Jansen, B. J., & Schuster, S. (2011). Bidding on the buying funnel for sponsored search and keyword advertising. Journal of Electronic Commerce Research, 12(1), 1–18.
-
Jansen, B. J., Sobel, K., & Zhang, M. (2011). The brand effect of key phrases and advertisements in sponsored search. International Journal of Electronic Commerce, 16(1), 77–106. doi:10.2753/JEC1086-4415160103
-
Jansen, B. J., & Spink, A. (2009). Investigating customer click through behaviour with integrated sponsored and non-sponsored results. International Journal of Internet Marketing and Advertising, 5(1), 74–94. doi:10.1504/ IJIMA.2009.021951
-
Ji, L., Rui, P., & Hansheng, W. (2010). Selection of best keywords: A Poisson regression model. Journal of Interactive Advertising, 11(1), 27–35. doi:10.1080/15252019.2010.10722175
-
Kim, N. Y., & Sundar, S. S. (2010). Relevance to the rescue: Can “smart ads” reduce negative response to online ad clutter? Journalism & Mass Communication Quarterly, 87(2), 346–362. doi:10.1177/107769901008700208
-
Kitts, B., & Leblanc, B. (2004). Optimal bidding on keyword auctions. Electronic Markets, 14(3), 186–201. doi:10.1080/1019678042000245119
-
Lancaster, G., & Withey, F. (2006). CIM Coursebook 06/07 Marketing Fundamentals. Butterworth-Heinemann.
-
Lavidge, R. J., & Steiner, G. A. (1961). A model for predictive measurements of advertising effectiveness. Journal of Marketing, 25(6), 59–62. doi:10.1177/002224296102500611
-
Lee, L., & Ariely, D. (2006). Shopping goals, goal concreteness, and conditional promotions. The Journal of Consumer Research, 33(1), 60–70. doi:10.1086/504136
-
Li, H., & Yang, Y. (2020). Optimal keywords grouping in sponsored search advertising under uncertain environments. International Journal of Electronic Commerce, 24(1), 107–129. doi:10.1080/10864415.2019. 1683704
-
Li, J., Pan, R., & Wang, H. (2010). Selection of best keywords: A Poisson regression model. Journal of Interactive Advertising, 11(1), 27–35. doi:10.1080/15252019.2010.10722175
-
Lu, S., & Yang, S. (2017). Investigating the spillover effect of keyword market entry in sponsored search advertising. Marketing Science, 36(6), 813–1017. doi:10.1287/mksc.2017.1053
-
Lu, X., & Zhao, X. (2014). Differential effects of keyword selection in search engine advertising on direct and indirect sales. Journal of Management Information Systems, 30(4), 299–325. doi:10.2753/MIS0742-1222300411
-
Meyerson, M., & Scarborough, M. E. (2007). Mastering online marketing: 12 keys to transform your website into a sales powerhouse. Entrepreneur Press.
-
Muthukrishnan, S., Pál, M., & Svitkina, Z. (2010). Stochastic models for budget optimization in search-based advertising. Algorithmica, 58(4), 1022–1044. doi:10.1007/s00453-009-9311-6
-
Naldi, M., D’Acquisto, G., & Italiano, G. F. (2010). The value of location in keyword auctions. Electronic Commerce Research and Applications, 9(2), 160–170. doi:10.1016/j.elerap.2009.09.002
-
Nottorf, F., & Funk, B. (2013). A cross-industry analysis of the spillover effect in paid search advertising. Electronic Markets, 23(3), 205–216. doi:10.1007/s12525-012-0117-z
-
Özlük, Ö., & Cholette, S. (2007). Allocating expenditures across keywords in search advertising. Journal of Revenue and Pricing Management, 6(4), 347–356. doi:10.1057/palgrave.rpm.5160110
-
Ramos, A., & Cota, S. (2008). Search Engine Marketing. McGraw-Hill, Inc.
-
Rutz, O. J., & Bucklin, R. E. (2011). From generic to branded: A model of spillover in paid search advertising. JMR, Journal of Marketing Research, 48(1), 87–102. doi:10.1509/jmkr.48.1.87
-
Rutz, O. J., Bucklin, R. E., & Sonnier, G. P. (2012). A latent instrumental variables approach to modeling keyword conversion in paid search advertising. JMR, Journal of Marketing Research, 49(3), 306–319. doi:10.1509/ jmr.10.0354
-
Scholza, M., Brenner, C., & Hinz, O. (2019). AKEGIS: Automatic keyword generation for sponsored search advertising in online retailing. Decision Support Systems, 119, 96–106. doi:10.1016/j.dss.2019.02.001
-
Tunuguntla, V., Basu, P., Rakshi, K., & Ghosh, D. (2019). Sponsored search advertising and dynamic pricing for perishable products under inventory-linked customer willingness to pay. European Journal of Operational Research, 276(1), 119–132. doi:10.1016/j.ejor.2018.12.026
-
Vragov, R., & Shang, R. D. (2020). A 2020 perspective on “Let’s play the search game: Strategic and behavioral properties of online sponsored search auction mechanisms. Electronic Commerce Research and Applications, 41(May–June), 100959. doi:10.1016/j.elerap.2020.100959
-
Vragov, R., Shang, R. D., Smith, V., & Porter, D. (2019). Let’s play the search game: Strategic and behavioral properties of sponsored search auction mechanisms. Electronic Commerce Research and Applications, 33(January–February), 100809. doi:10.1016/j.elerap.2018.10.001
-
Yang, S., & Ghose, A. (2010). Analyzing the relationship between organic and sponsored search advertising: Positive, negative, or zero interdependence? Marketing Science, 29(4), 602–623. doi:10.1287/mksc.1090.0552
-
Yang, S., Pancras, J., & Song, Y. (2021). Broad or exact? Search Ad matching decisions with keyword specificity and position. Decision Support Systems, 143, 113491. doi:10.1016/j.dss.2021.113491
-
Yang, Y., Qin, R., Jansen, B. J., Zhang, J., & Zeng, D. (2014). Budget planning for coupled campaigns in sponsored search auctions. International Journal of Electronic Commerce, 18(3), 39–66. doi:10.2753/JEC1086-4415180302
-
Yang, Y., Zhang, J., Qin, R., Li, J., Wang, F. Y., & Qi, W. (2012). A budget optimization framework for search advertisements across markets. Systems, Man and Cybernetics, Part A: Systems and Humans, IEEE Transactions on, 42(5), 1141-1151.
-
Young, R. A., Weiss, A. M., & Stewart, D. W. (2006). Marketing Champions: Practical Strategies for Improving Marketing’s Power, Influence, and Business Impact. Wiley.
-
Zhang, J., Yang, Y., Li, X., Qin, R., & Zeng, D. (2014). Dynamic dual adjustment of daily budgets and bids in sponsored search auctions. Decision Support Systems, 57, 105–114. doi:10.1016/j.dss.2013.08.004
-
Zhang, J., Zhang, J., & Chen, G. (2021). A semantic transfer approach to keyword suggestion for search engine advertising. Electronic Commerce Research. Advance online publication. doi:10.1007/s10660-021-09496-7
-
Zhang, M., & Feng, J. (2011). Cyclical bid adjustments in search-engine advertising. Management Science, 57(9), 1703–1719. doi:10.1287/mnsc.1110.1408
-
Zhang, W., Zhang, Y., Gao, B., Yu, Y., Yuan, X., & Liu, T. (2012). Joint optimization of bid and budget allocation in sponsored search. Proceedings of the 18th ACM SIGKDD international conference on Knowledge discovery and data mining, 1177-1185.
-
Zhao, J., Qiu, G., Guan, Z., Zhao, W., & He, X. (2018). Deep reinforcement learning for sponsored search real-time bidding. KDD ‘18: Proceedings of the 24th ACM SIGKDD International Conference on Knowledge Discovery & Data Mining, 1021–1030. doi:10.1145/3219819.3219918