Keyword Portfolio Optimization
Keyword portfolio optimization in paid search advertising
Section titled “Keyword portfolio optimization in paid search advertising”12 March 2022
Keywords:
OR In marketing Paid search advertising Budget allocation Markowitz portfolio theory Search volume index
ABSTRACT
Section titled “ABSTRACT”This paper uses investment portfolio theory to determine budget allocation in paid online search advertising. The approach focuses on risk-adjusted performance and favors diversified portfolios of unrelated or negatively correlated keywords. An empirical investigation employs averages, variances and covariances for keyword popularities, which are estimated using growth rates for 15 major sectors taken from the Google Trends database. In line with portfolio theory, the results show that the average keyword popularity growth is strongly related to the standard deviation of growth for each keyword in the sample ( ). Hypothesis testing of differences in Sharpe ratios documents a significantly better performance of the proposed approach compared to that of other strategies currently used by practitioners.
1. Introduction
Section titled “1. Introduction”The paid search advertising market determines prices for keywords through competitive auctions set up by internet giants such as Google, Baidu and Yahoo! (for a description, see Abou Nabout, Lilienthal, & Skiera, 2014; Edelman, Ostrovsky, & Schwarz, 2005; Tunuguntla, Basu, Rakshit, & Ghosh, 2019). Companies in the US spent over $54.7 billion in 2019 on advertisements targeted to match keywords searched online by potential customers. This is the largest component of the rapidly growing internet advertising market that has reached $125 billion in 2019. Search advertising is a considerable investment for some companies, which can run into hundreds of millions of dollars each year. For example, data from 2019 suggest that the three leading paid search advertisers in the US spent $1.87 billion in total. In particular, Expedia spent $802 million, which represents 6.65% of the total revenue, or, almost as much as the operating income for 2019.2
But how do companies decide on which keywords to choose and how much to spend on each one in return for uncertain publicity and sales? Although suboptimal decisions in marketing are associated with waste of useful resources (e.g., Mantrala, 2002). there is still no consensus in the academic literature (as highlighted in the recent reviews by Kim et al. 2021 and Jang et al. 2021). Desai, Shin, & Staelin (2014) investigate the choice of a firm buying its own brand name, or a competitor’s brand name as a keyword. By comparing consumer click behavior with advertiser bidding patterns, Kim, Jang, & Shin (2021) find that retailers may need to be more selective in keyword choice. The analysis of Jang, Kim, & Yoon (2021) suggests that advertisers can allocate budgets more efficiently if they consider interrelationships among keywords. In practice advertisers rely on ad hoc heuristics to assess the performance of individual keywords. As noted by Rutz, Trusov, & Bucklin (2011), the main approaches include: “direct marketing strategies” in which for each keyword a cost benefit analysis compares advertising-related profits and costs per sale (e.g., see Rusmevichientong & Williamson, 2006; Selçuk & Özlük, 2013; Yang, Xiao, & Wu, 2020), “model free-strategies” which look at the aggregate sales performance of alternative keyword sets (e.g., the “long tail” or popular “short head” keyword strategies, see Skiera, Eckert, & Hinz, 2010 and Jerath, Ma. & Park, 2014), and “conversion model-based strategies” which employ keyword characteristics to estimate conditional performance metrics for individual keywords (e.g., Ghose & Yang, 2009; Jang et al., 2021; Kim et al., 2021; Rutz et al., 2011).
Corresponding author. Norwich Business School, University of East Anglia, Norwich, NR4 7 TJ, UK.
E-mail addresses: E.Symitsi@leeds.ac.uk (E. Symitsi), R.Markellos@uea.ac.uk (R.N. Markellos), mmantrala@ku.edu (M.K. Mantrala).
<sup>1 IAB Internet Advertising Revenue Report, 2020, PwC.
<sup>2 Leading National Advertisers report, 2020 edition. The total spend on search advertising for the top 10 companies is $24.4 billion. Spending for individual companies (in millions of USD) is: Expedia (802), Booking (666), Amazon (410), LendingTree (312), AT&T (206), TripAdvisor (204), Progressive (204), Verizon (183), IAC (170), Experior (165)
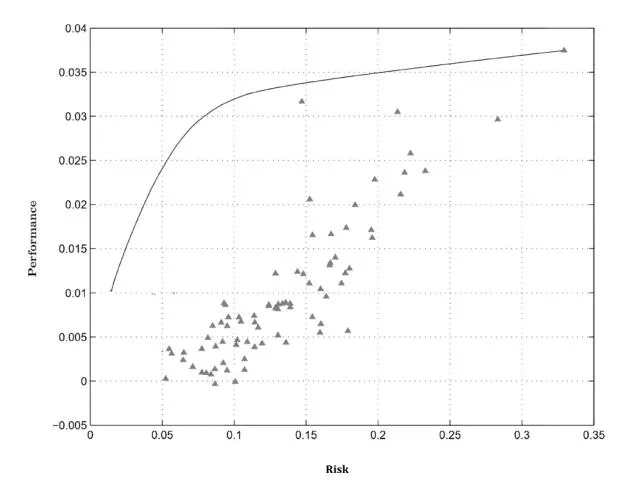
Fig. 1. Keyword-strategy Performance vs Risk for Search Advertising Note: Triangles represent individual keywords while the solid line represents the Markowitz efficient frontier, which consists of optimal keyword combinations that maximize performance for a given level of risk.
The current approaches on keyword selection for search advertising suffer from four main problems. First, they have no theoretical grounding and rely on ad hoc procedures. Second, they do not build on the extensive literature on decision making in OR and business. Third, they have problems in implementation as they usually require data that is not readily available. Fourth, there is no performance measurement yardstick or empirical evidence on the value of alternative approaches. The present paper attempts to address these problems by proposing that firms use the meanvariance portfolio theory of Markowitz (1952) to determine the optimal allocation of funds in search advertising.3 It is demonstrated how the theory can be implemented in practice and how performance can be compared against popular heuristics currently used by managers. It is argued that the proposed approach offers theoretical validity, application consistency and empirical superiority over alternatives.
The principle behind mean-variance theory in search advertising is simple. Assume that a firm is considering two alternative (sets of) keywords for search advertising that have identical expected performance in terms of, for example, increasing sales and profits. Other things being equal, the firm should choose the kevword (set) that is safest in that it leads to the least uncertain performance. Even if the firm as a whole is assumed to have an indifferent or neutral attitude towards risk (e.g., Brick & Jagpal, 1984), risk aversion is relevant as managers commonly identify risk management as a top priority (Rawls & Smithson, 1990) and undertake hedging (Bartram, Brown, & Fehle, 2009; Howton & Perfect, 1998). The attitude of managers towards risk is justified on a variety of reasons that include the convexity of tax codes, costs of financial distress, costly external financing and principal-agent problems (see, Bickel, 2006). For a recent discussion of corporate decision making under risk aversion see Li, Qi, & Li (2021).
In terms of exposition, Fig. 1 depicts the performance/risk trade-off for individual keywords along with their optimal combinations in what is called an “efficient frontier” under mean-variance portfolio theory. Keyword sets (or portfolios) on the efficient frontier will always be preferred by managers over other sets or individual keywords that produce lower expected performances for the same level of risk (or the same expected performance for a higher level of risk). A key practical result is that risk
can be reduced through diversification by advertising in keywords that have unrelated or inversely related performances. Diversification is a “free lunch” for advertisers as it creates a benefit in terms of reducing outcome uncertainty at no extra cost. Assume, for example, that in the context of a search advertising campaign, a firm has to decide on how much to spend on keyword A and B, respectively. These keywords have the following characteristics in terms of advertising investment return or performance (r) and risk ( ), respectively: , , and If the manager ignores risk, then all the budget should be spent on A as it provides the highest return. If risk is a consideration, then information on the correlation between A and B is also needed in order to decide. In the extreme case that A and B are perfectly correlated, then no diversification benefits are available, and the optimal decision is to choose the combination of keywords with a risk-adjusted performance that matches the risk appetite of the decision maker. In the opposite extreme case that A and B are perfectly negatively correlated, it can be shown that there exists an entirely riskless combination of keywords with weights and , respectively. The benefits from diversification and the relative weights of advertising spend between keywords depend critically on correlation. For a discussion of the mathematics behind portfolio theory and this example, see Markowitz (1952).
The motivation for using Markowitz portfolio theory stems from Dhar & Ghose (2010) who draw direct analogies between search advertising markets and financial markets. The authors note that search advertising decisions can be solved as portfolio optimization problems of maximizing risk-adjusted returns. Portfolio theory is first proposed in advertising by Holthausen Jr & Assmus (1982) for optimal budget allocation when sales responses are uncertain across different market segments. A number of other studies apply a similar approach to problems in advertising and, more generally, in marketing (e.g., Borgs et al., 2007; Cardozo & Smith Jr, 1983; 1985; De Kluyver & Baird, 1984; Devinney, Stewart, & Shocker, 1985; Gönsch, 2017; Jagpal & Brick, 1982; Ryals, Dias, & Berger, 2007; Zhang & Lu, 2009). In general, interdisciplinary approaches between finance and marketing have found several useful business applications (see Jagpal et al., 2008). Li et al. (2021) discuss the use of the mean-variance as a risk criterion for corporate risk-averse decision making.
Existing studies of the mean-variance approach in marketing are severely limited by the availability of sales data in relation to advertising. Obtaining reliable sales covariance estimates is particularly challenging as they do not only require a sufficient sample size but also synchronous sampling. An additional problem is that of attribution since it is not possible always to draw a direct link between online advertising and sales for individual consumers (see Köhler, Mantrala, Albers, & Kanuri, 2017; Xu, Duan, & Whinston, 2014). These problems are overcome in the present paper by using a new broad proxy of sales activity in the context of search advertising. This proxy is based on variations in online search intensity for various keywords using data drawn from the Google Trends database. The underlying assumption is that an increase in keyword popularity is associated through search advertising with an increase in sales. As Google is the leading search advertising provider and the source of the search intensity data, consistency is ensured. Moreover, Google Trends offers a reliable and openly available source of high-quality historical data at monthly, weekly and daily sampling frequencies. The fact that sales data is not needed means that inferences can be drawn also for new products and services.
This paper undertakes the first comprehensive empirical study of the mean-variance approach in advertising and marketing. The approach used is an in-sample regression analysis along with parametric and non-parametric hypothesis testing. The goal is to test
See also a collection of papers edited by Zopounidis, Doumpos, & Fabozzi (2014).
the validity of the proposed approach and to assess its performance against alternative heuristic rules that are popular amongst practitioners. Specifically, the efficient frontiers of search advertising spend are estimated for 15 major sectors. Each point on the frontier represents an optimal portfolio of keyword investments that maximizes the expected overall growth in search intensity for a given level of risk. Data is drawn from Google Ad Words and Google Trends. As Google Ad Words penalizes irrelevant advertisers and provides a separate population of keywords available to bid for each sector, each sector has different efficient frontier. The first major finding is that for all sectors there is a strong positive relationship between keyword performance (average historical growth in popularity) and risk (standard deviation of growth). This adds validity to the proposed approach as mean-variance theory posits that riskier investments have higher expected returns. The second major empirical finding is that for all sectors, mean-variance optimal portfolios of keywords offer statistically significant improvements in performance over popular alternatives. The alternatives are based on heuristic rules that rank keywords on the basis of click-through rates, popularities and cost-per-reservation ratios, respectively.
The next section discusses the theoretical framework used in the paper on the basis of Markowitz portfolio theory. The third section summarizes the empirical analysis of the performance of the proposed approach against that of popular strategies used by practitioners. The final section concludes the paper.
2. A Portfolio Theory framework for paid search advertising decisions
Section titled “2. A Portfolio Theory framework for paid search advertising decisions”This section describes the theoretical foundation of the paper. It is a direct adaptation of the Markowitz portfolio theory (see Markowitz, 1952) as has been done in the past by Holthausen Jr & Assmus (1982), Dhar & Ghose (2010), and others. Although the methodology is well known in marketing and finance, it has not been previously applied to search advertising.
Assume a simple framework in which a manager considers investing an amount x from the total available wealth w on paid search advertising. As advertising is a risky activity, two states exist for wealth (w) that result from a “good” return (rg) or “bad” return (rb) in sales, respectively:
(1)
(2)
If the good state occurs with probability p and the bad state with probability (1 − p), the expected utility (EU) for investment x is:
(3)
The derivative of EU with respect to x measures the rate at which the expected utility changes with respect to the amount invested in advertising:
(4)
The second derivative of EU with respect to x implies a concave utility function with u (w) < 0 for every level of wealth:
(5)
In line with manager risk aversion, the concave utility function means that the level of utility increases with wealth at a diminishing rate. The marginal change in expected utility for the first dollar is found by the first derivative at x = 0:
(6)
(7)
The expression in the brackets is the expected return of the advertising choice and links utility with returns. The manager determines the optimal choice x to invest by setting the first derivative equal to zero. The portfolio theory of Markowitz is reconciled with the utility approach by assuming that managers have quadratic utility, or, that investment returns are jointly normally distributed variables. Moving from the level of wealth to the return on a risky portfolio in the utility function allows the representation of the mean-variance optimization problem. The expected utility of the return is given by a second-order Taylor expansion as a function of mean and variance:
(8)
= u(\bar{r_p}) + \frac{1}{2}u''(\bar{r_p})\sigma_p^2 \tag{9}
Having to select the optimal budget allocation across keywords in paid search advertising is a problem similar to the allocation of investment capital amongst risky stocks. Ni is defined as the search intensity of online users for each one of the possible relevant keywords i with i = (1, 2, …, K). From each stream of visitors, a proportion of them goes on to visit the advertised website with a click-through-rate φi. From these visitors, a proportion yi, known as the conversion rate, complete a purchase. Assuming that Mi is the profit of each purchase that is generated through keyword i, the total income is given by the product MiφiyiNi.
Online marketing spend in sponsored advertising differs from that in other channels in that the former is a linear function of the number of queries. It differs also from other types of online advertising such as banners that do not have a purely performancebased cost. In the case of paid search advertising, the cost is a function of the number of users who click on the sponsored advertisement that is displayed along with the so-called “organic” results for keyword i. In other words, the total advertising expense is a function of converted visitors to the website of the advertiser given by ci,tφiNi, where ci,t is the Cost Per Click (CPC) for keyword i. The profit that is associated with each keyword i can be calculated as a function of Ni:
(10)
In a discrete time model, we assume that for the same advertiser the parameters in λ*i,t* remain constant for a small change of time from period 0 to period 1. In practical terms, this period could cover a calendar day. Although there is no relevant published evidence, it is reasonable to assume that these parameters vary between advertisers but remain relatively stable across time. The growth in profit can be calculated as:
(11)
Advertising related profit growth (or return) is expressed in this equation as a percentage change in incoming traffic which is approximated by the growth rate in keyword popularity. Since the web traffic for each keyword is stochastic, this growth is risky. Consider the case of allocating a budget across K > 2 risky choices, which form a portfolio of keywords. Let w1, w2, …, wK be the percentage allocation of the budget subject to the constraint:
w_1 + w_2 + \ldots + w_K = 1 \tag{12}
A non-negativity constraint on weights is imposed:
w_i \ge 0 \tag{13}
Under portfolio theory, the expected portfolio return rp and risk σ 2 p are given on the basis of the mean and variance:
(14)
(15)
The so-called efficient frontier of keyword portfolios can be derived with inequality constraints solving a quadratic programming problem:
s.t.
From this optimization problem, it can be deduced that for a portfolio of keywords, advertisers should focus their attention on expected changes in the incoming traffic associated with each keyword along with the variance-covariance of changes in traffic. Under the above assumptions, the budget allocation decision is independent of click-through-rates, conversion rates and the advertising cost and it depends solely on the search behavior of online consumers. Budget allocations that maximize advertising profit without accounting for the variance-covariance may lead to results that are not in line with the objectives of risk-averse decision making. Within a mean-variance framework, the performance is maximized for a specific level of risk. Risk is reduced when funds are shifted from highly volatile keywords to keywords with more stable variation. Risk is also reduced when funds are shifted from keywords with positively correlated variation to keywords with weaker or more negatively correlated variation.
Finally, it is important to note that the proposed approach uses a novel representation of the advertising objective in terms of maximizing the growth in firm profits at a given level of risk. This is consistent with the application of the mean-variance approach in finance where portfolio stock growth rates (or returns), rather than price levels, are used. The representation is different than existing approaches in marketing that focus on maximizing levels of sales, or profits (e.g., see Holthausen Jr & Assmus, 1982). As in finance, the use of levels is problematic in practice as direct calculations across investments and time are not possible due to nonstationarity.
3. Empirical application
Section titled “3. Empirical application”3.1. Sample and descriptive statistics
Section titled “3.1. Sample and descriptive statistics”In order to demonstrate the application of the proposed approach, a study is undertaken to investigate the problem of selecting the optimal set of keywords for paid search advertising in 15 different sectors. The choice of sectors follows Abou Nabout et al. (2014) and is representative of a variety of products and services that have an active search advertising market.
The relevant keywords for each sector are extracted using the Keyword Planner service of Google Ad Words. This provides advertisers with tools to define sets of keywords that are relevant to their websites. In the Google Ad Words auctions, bidding success depends also on a quality score that increases when the relevance of the keyword to the landing page of the advertiser is higher. In this way, biding from irrelevant companies is limited in order to avoid annoying search engine users. The implication for the analysis is that the population from which the keywords will be selected, and the optimal portfolio will vary between sectors. Google Ad Words provides advertisers with a variety of metrics that form the basis for heuristic strategies used in practice for keyword selection. The average monthly searches (AMS) reflect the number of times people have searched a keyword over the last 12 months and captures popularity. The click-through-rate (CTR) is the proportion of users who click on the sponsored link. The cost-per-click (CPC) for each keyword shows the average estimated amount that the advertiser is charged each time a user clicks on the sponsored linked and lands on the web page of the advertiser. The cost-perreservation (CPR) is another measure of keyword performance that is estimated as the ratio of CPC to CTR. The analysis only includes keywords that have information on these metrics in order to enable a comparison of the keyword selection method proposed in this paper with heuristic strategies. Some summary statistics about the keywords used and their key metrics for the 15 sectors studied appear in Table 1. Although the initial population of relevant keywords suggested by Google Ads can reach 800 in some sectors, after filtering the number ranges between 43 (Internet and Telecommunications) and 323 (Home Appliances) with an average of 161 across sectors. There is a wide variation and some extreme values in the metrics studied for the keywords in each sector. This suggests that the merit of keyword selection methods will be evaluated under various parameter ranges. The data on the set of relevant keywords and the relevant metrics was drawn from Google Ad Words on September 11, 2015.
As discussed, in the proposed model the profit growth for each keyword is expressed as a function of variations in incoming traffic. In order to measure the latter, the Search Volume Index (SVI) time series data produced by Google Trends is drawn for each one of the keywords identified in the previous step. Specifically, the average and variance for the arithmetic changes in SVIs are estimated along with their covariance matrix. SVIs have been used in a variety of applications including, for example, finance (Da, Engelberg, & Gao, 2011; Vlastakis & Markellos, 2012), marketing (Goel, Hofman, Lahaie, Pennock, & Watts, 2010; Vosen & Schmidt, 2011; Wu & Brynjolfsson, 2015) and epidemiology (Copeland et al., 2013; Dugas et al., 2013; Nikolopoulos, Punia, Schäfers, Tsinopoulos, & Vasilakis, 2020). Applications in advertising include Zigmond & Stipp (2010) and Joo, Wilbur, Cowgill, & Zhu (2013) that report a link between television ads and search activity on Google.
The SVI quantifies the search intensity and popularity of specific keywords. The values range from 0 to 100 as the absolute number of searches is divided by the maximum number of searches for the period under consideration. However, the search terms need a minimum volume to be included in the result, thus a zero value reflects either the non-availability of information for a specific term or very low search interest. Only keywords with a history of at least one year and no missing values are analyzed. In the robustness checks, the analysis is repeated using a sample of 5 years and obtains comparable results (see Online Appendix, Part I). Although the highest sampling frequency available is daily, weekly data is also analyzed in order to increase the coverage in terms of keywords. Keywords that have constant SVIs between successive periods for more than 25 percent of the sample are discarded. In our robustness checks the analysis is repeated using a threshold of 10 percent of the sample to obtain comparable results (see Online Appendix, Part II).
Table 2 presents descriptive statistics of changes in SVIs for the keywords in each sector analysed in the previous step (summarized in Table 1). The results indicate a significant average growth in the keywords considered which exceeds 43 percent on an annual basis. Variability is also substantial with the average annu-
Table 1 Descriptive Statistics for Keywords (as of September 11, 2015).
| Industry | No | AMS | Clicks | CTR | CPC | CPR |
|---|---|---|---|---|---|---|
| Advertising Services | 141 | 945,217 | 316 | 0.0306 | 1.2003 | 19.67 |
| Beauty | 150 | 395,431 | 155 | 0.0620 | 0.8186 | 10.36 |
| Consumer Electronics | 111 | 232,365 | 233 | 0.0246 | 0.8909 | 4.52 |
| Fashion & Style | 128 | 258,391 | 52 | 0.0278 | 0.7252 | 1.97 |
| Finance | 68 | 361,157 | 607 | 0.0113 | 0.9728 | 4.43 |
| Health | 216 | 307,837 | 265 | 0.0282 | 0.8424 | 4.96 |
| Hobbies & Leisure | 181 | 449,210 | 344 | 0.0395 | 0.8690 | 1,003.25 |
| Home Appliances | 323 | 101,687 | 206 | 0.0462 | 0.9475 | 26.26 |
| Internet | 120 | 3,986,893 | 330 | 0.0404 | 0.9764 | 3.19 |
| Internet & Telecommunications | 43 | 788,313 | 319 | 0.0230 | 1.0577 | 5.98 |
| Management Consulting | 93 | 87,458 | 15 | 0.0256 | 0.8740 | 15.20 |
| Motor Vehicles | 223 | 459,752 | 326 | 0.0921 | 0.8950 | 135.20 |
| Real Estate | 189 | 841,673 | 546 | 0.0579 | 0.8905 | 328.09 |
| Social Network | 167 | 63,572 | 12 | 0.0790 | 0.6546 | 0.56 |
| Travel & Tourism | 269 | 384,925 | 174 | 0.1284 | 0.9605 | 165.44 |
| Average | 161 | 644,259 | 260 | 0.0478 | 0.9050 | 115.27 |
Table 2 Descriptive Statistics of Changes in Google Trends SVIs (10/11/14-9/11/15).
| Industry | μ | σ | ρ |
|---|---|---|---|
| Advertising Services | 0.0063 | 0.1185 | 0.1895 |
| Beauty | 0.0079 | 0.1054 | 0.0417 |
| Consumer Electronics | 0.0073 | 0.1223 | 0.1829 |
| Fashion & Style | 0.0166 | 0.1817 | 0.0207 |
| Finance | 0.0108 | 0.1362 | 0.2445 |
| Health | 0.0079 | 0.1149 | 0.2402 |
| Hobbies & Leisure | 0.0126 | 0.1363 | 0.0254 |
| Home Appliances | 0.0116 | 0.1395 | 0.1184 |
| Internet | 0.0039 | 0.0906 | 0.0275 |
| Internet & Telecommunications | 0.0041 | 0.1016 | 0.0212 |
| Management Consulting | 0.0125 | 0.1603 | 0.1867 |
| Motor Vehicles | 0.0061 | 0.0949 | 0.0597 |
| Real Estate | 0.0072 | 0.1150 | 0.2093 |
| Social Network | 0.0015 | 0.1122 | 0.0301 |
| Travel & Tourism | 0.0098 | 0.1314 | 0.0960 |
| Average | 0.0084 | 0.1241 | 0.1138 |
Note: This table presents the average mean (μ) and standard deviation (σ) for weekly percentage changes in SVIs. The last column estimates the average correlation (ρ) between all keywords in each sector.
alized standard deviation reaching 90 percent. In order to get a sense of the correlation between keywords, which as discussed in the model may be a significant source of risk, the last column reports the average correlation. Although the overall correlation is positive at 11.38 percent, individual correlations have a wide range with one in three having a negative value. This suggests that there is significant scope for keyword diversification.
3.2. Keyword portfolio optimization
Section titled “3.2. Keyword portfolio optimization”A key prediction of mean-variance portfolio theory is a linear relationship between expected returns and standard deviation. This reflects the higher compensation that decision makers require for assuming additional risk. In order to test this prediction, the average popularity growth is regressed against the standard deviation for each keyword in the sample (see Cardozo & Smith Jr, 1983, for a similar analysis on product portfolio management). The results in Table 3 confirm a significant positive relationship between the average changes in SVIs and the standard deviation of these changes. The relationship is strong with an average R-squared of over 74 percent across sectors. Keywords with high growth rates, which have strong potential in terms of popularity and advertising, carry also significant uncertainty in terms of this rate being realized.
The next step is the application of mean-variance optimization in order to determine for each sector the optimal keyword portfolio weights that will maximize the SVI growth for a given level of
Table 3 Regression of Average Changes against Standard Deviation of SVIs.
| Industry | Slope | t-statistic | R-squared |
|---|---|---|---|
| Advertising Services | 0.1252 | 8.0163 | 0.5883 |
| Beauty | 0.1558 | 9.7743 | 0.8952 |
| Consumer Electronics | 0.1194 | 14.9268 | 0.8981 |
| Fashion & Style | 0.1910 | 11.5079 | 0.8922 |
| Finance | 0.1980 | 17.7165 | 0.9607 |
| Health | 0.1444 | 14.0457 | 0.8625 |
| Hobbies & Leisure | 0.1741 | 15.6413 | 0.9662 |
| Home Appliances | 0.1339 | 24.9750 | 0.8386 |
| Internet | 0.1393 | 5.7099 | 0.7979 |
| Internet & Telecommunication | 0.0862 | 9.7279 | 0.2576 |
| Management Consulting | 0.1436 | 7.5642 | 0.6058 |
| Motor Vehicles | 0.1331 | 9.7124 | 0.7313 |
| Real Estate | 0.1353 | 19.4841 | 0.7432 |
| Social Network | 0.0859 | 6.8149 | 0.3676 |
| Travel & Tourism | 0.1357 | 9.2588 | 0.7422 |
| Average | 0.1401 | 12.3251 | 0.7432 |
risk. The solution to this quadratic programming problem produces points of feasible keyword portfolios with the maximum return at every level of risk, or equivalently the minimum risk at every level of return.4 In line with the financial literature, portfolios satisfying these criteria are coined “efficient portfolios” and form a curve known as the “efficient frontier”. In order to ease exposition, 100 optimal portfolios are produced for each sector spaced equally in terms of returns. The leftmost edge of the obtained frontier is the so-called minimum variance portfolio, that is, the portfolio with the lowest possible risk. The portfolio with the maximum risk adjusted performance in terms of the ratio of growth over standard deviation is also estimated. Assuming a risk free rate of zero, this corresponds to the so-called Sharpe ratio in the financial literature. Advertisers will select a portfolio from the efficient frontier on the basis of their risk preferences. For example, advertisers that are highly risk averse will prefer solutions with lower risk that lie at the bottom of the frontier close to the minimum variance portfolio.
The subsequent step in the analysis involves the comparison of the proposed approach against alternative methods that are currently used in practice (see Rusmevichientong & Williamson, 2006; Rutz & Bucklin, 2007; Rutz et al., 2011). Five such benchmark portfolios (BP) based on alternative methods are considered:
4 A linear complementarity programming algorithm (see Cottle & Dantzig, 1968), lcprog, is the default solver employed by the Matlab Financial Toolbox for the solution of the mean-variance portfolio problem described in the paper.
Table 4 Keyword Portfolio Sizes for Different Keyword Selection Strategies.
| Industries | EP | MVP | SRP | BP1 | BP2 | BP3 | BP4 | BP5 |
|---|---|---|---|---|---|---|---|---|
| Advertising Services | 21 | 33 | 34 | 18 | 123 | 45 | 115 | 141 |
| Beauty | 13 | 41 | 39 | 39 | 111 | 33 | 129 | 150 |
| Consumer Electronics | 11 | 32 | 31 | 25 | 86 | 39 | 89 | 111 |
| Fashion & Style | 13 | 45 | 48 | 31 | 97 | 39 | 87 | 128 |
| Finance | 9 | 16 | 16 | 18 | 50 | 30 | 58 | 68 |
| Health | 13 | 44 | 45 | 69 | 147 | 55 | 168 | 216 |
| Hobbies & Leisure | 13 | 48 | 46 | 33 | 148 | 59 | 180 | 181 |
| Home Appliances | 38 | 24 | 50 | 71 | 252 | 96 | 276 | 323 |
| Internet | 12 | 42 | 38 | 21 | 99 | 28 | 89 | 120 |
| Internet & Telecommunications | 9 | 26 | 23 | 12 | 31 | 17 | 33 | 43 |
| Management Consulting | 9 | 26 | 27 | 19 | 74 | 30 | 77 | 93 |
| Motor Vehicles | 11 | 43 | 46 | 41 | 182 | 41 | 214 | 223 |
| Real Estate | 21 | 37 | 35 | 27 | 162 | 52 | 185 | 189 |
| Social Network | 17 | 77 | 45 | 54 | 113 | 45 | 129 | 167 |
| Travel & Tourism | 20 | 31 | 36 | 58 | 211 | 47 | 263 | 269 |
| Average | 15 | 38 | 37 | 36 | 126 | 44 | 139 | 161 |
Note: This table exhibits the number of keywords for each keyword selection strategy and sector studied. EP gives the average number of keywords for 100 equidistant portfolios on the efficient frontier. MVP is the minimum variance portfolio while SRP is the portfolio with the maximum Sharpe Ratio. BP1, BP2, BP3, BP4 and BP5 are the benchmark portfolios consisting of: the most popular keywords, the least popular keywords, the most expensive keywords, the cheapest keywords, and, all the keywords, respectively.
- BP1: invest equally in the keywords with above average AMS (most popular keywords approach).
- BP2: invest equally in the keywords with a below average AMS (least popular keywords or long tail approach).
- BP3: invest equally in the keywords with an above average CTR (most effective/expensive keywords approach).
- BP4: invest equally in the keywords with a below average CTR (cheapest effective keywords approach).
- BP5: invest equally in all keywords (naive approach).5
Table 4 presents information on the number of keywords that are selected for each sector and strategy studied. EP describes the average number of keywords across the 100 mean-variance optimized portfolios. MVP is the number of keywords included in the minimum variance portfolio and SRP is the number of keywords in the optimal risky portfolio with the highest Sharpe ratio. The mean-variance approach (MVP) selects on average a small number of keywords compared to other strategies considered. As expected, given the nature of the strategy, the naive approach has the largest number of keywords as it always selects all of them.
Figures a2, b2, and c2 depict the performance of the keyword selection approaches in terms of average growth in SVIs (vertical axis) and standard deviation of this growth (horizontal axis). The solid line corresponds to the efficient frontier for each sector with the minimum variance portfolio and maximum Sharpe ratio portfolio marked by solid circles and stars, respectively. Crosses show the position of the five benchmark keyword portfolios strategies while triangles represent individual keywords. A number of conclusions can be drawn from these figures. The portfolios on the efficient frontier dominate in terms of risk-adjusted performance all other portfolios and individual keywords. This is not surprising given that these are optimized to achieve this. However, the advantages offered by the mean-variance optimized portfolio appear to be substantial. Moreover, most of the alternative strategies appear to have a performance that is very conservative and offer low keyword growth. This is reflected by the fact that the benchmark portfolios are located near the beginning of the axes and have low levels of keyword growth and risk. This means that the benchmark methods perhaps suit risk-averse advertisers but not necessarily those with a larger appetite for keyword growth and risk. It can also be seen that no specific benchmark strategy appears to dominate systematically in terms of return or risk. The benchmark portfolios lie close to each other in a region that is just below the minimum-variance portfolio and to each other.
However, the comparison between the performances of different portfolios cannot be based solely on graphical analysis or a simple comparison of values. This is because the estimation of portfolio parameters is based on historical information for a sample of SVIs and the population values are not known. The differences in performance may be statistically insignificant if sample variation is considered. In order to account for this, the study tests for statistical differences in risk-adjusted performance, as measured by the Sharpe ratio, between benchmark portfolios and the portfolio on the frontier that corresponds to the same level of standard deviation. The parametric JKM test (Jobson & Korkie, 1981; Memmel, 2003) is used to compute the statistics and the p-values of the difference in Sharpe ratios under the null hypothesis:
H_0: \frac{\hat{\mu}_i}{\hat{\sigma}_i} - \frac{\hat{\mu}_n}{\hat{\sigma}_n} = 0 \tag{16}
where i is the portfolio on the efficient frontier and n is the benchmark portfolio.
Ledoit & Wolf (2008) argue that the JKM test is not valid under fat tails, or when returns are serially correlated. To address this potential shortcoming, robust standard errors are estimated using a studentized time series bootstrap approach from the difference of the estimated Sharpe ratios. The analysis adopts the standard practice by applying the Ledoit & Wolf (2008) test under a two-sided hypothesis by simulating 5000 datasets using circular block bootstrapping. The critical values are then estimated by the empirical quantiles of the simulated datasets. Under this test, the estimated bootstrapped standard errors make no assumptions about the distribution of popularity growth.
Tables 5 and 6 present the test statistics and associated significance levels for the JKM test and the Ledoit and Wolf test, respectively ((for alternative hypothesis testing approaches see Ledoit & Wolf, 2011; 2018). Both tests reject the null hypothesis of equal Sharpe ratios for almost all cases. This means that despite the proximity of the benchmark portfolios to the efficient frontier for some sectors, the efficient portfolio at the same level of risk offers statistically significantly higher performance.
5 The naive, or 1/N approach has become a popular benchmark approach when considering alternative portfolio strategies following the paper by DeMiguel, Garlappi, & Uppal (2009). This and subsequent research has shown that sophisticated portfolio optimization approaches struggle to beat the naive approach due to the effect of estimation risk in samples of realistic size.
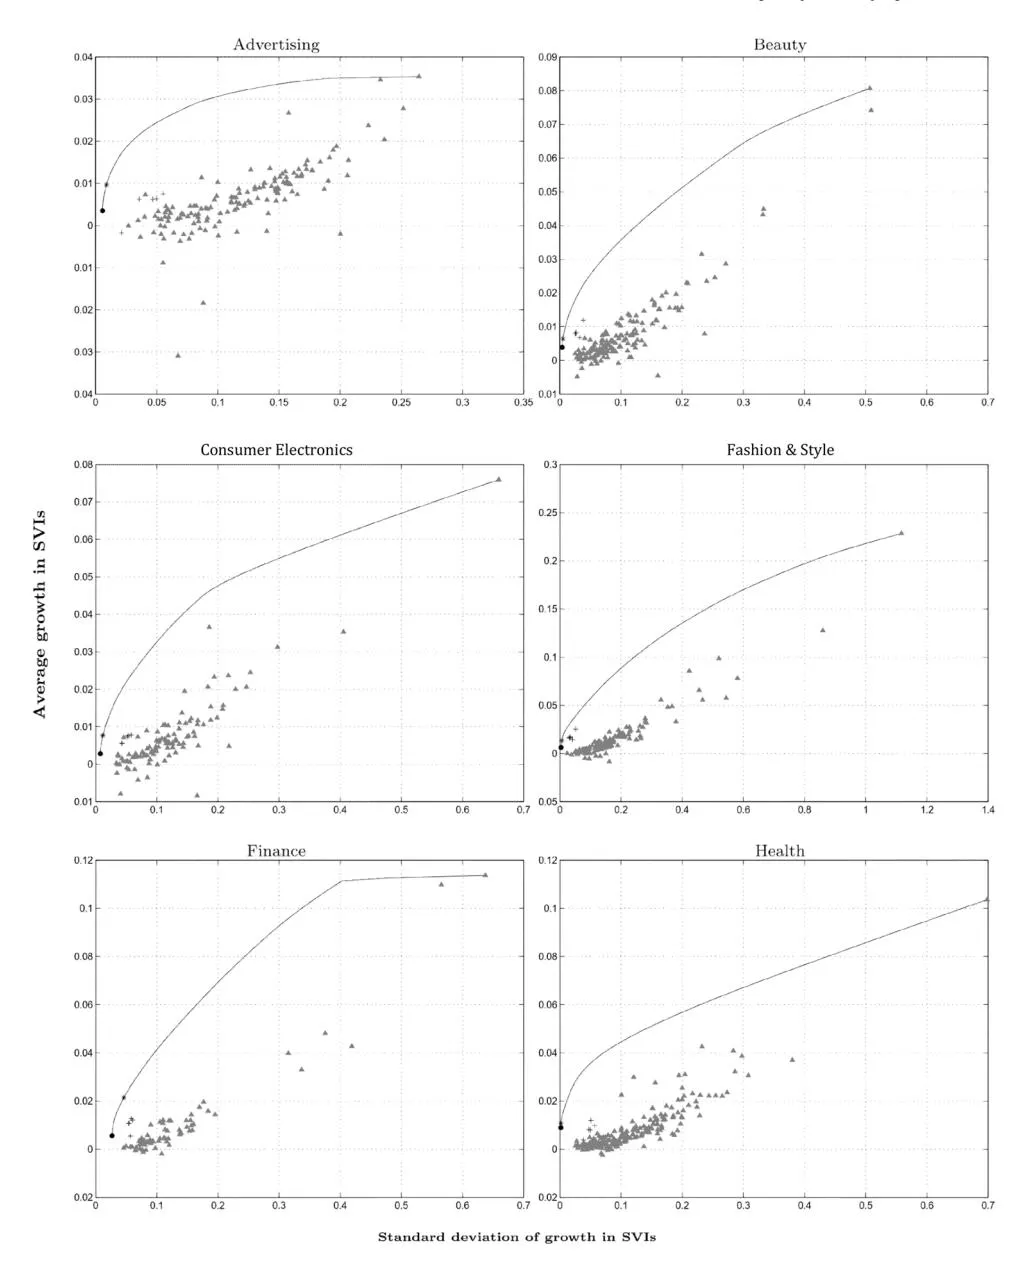
Fig. 2a. Efficient Keyword Frontiers and Alternative Keyword Selection Strategies Note: The figures display the risk (standard deviation in popularity growth) on the horizontal axis and the expected return (average popularity growth) on the vertical axis. Solid lines represent efficient keyword frontiers, filled circles and stars correspond to the minimum variance and the maximum Sharpe ratio portfolios, respectively. Crosses represent the five benchmark portfolios while triangles correspond to individual keywords.
Table 5 Jobson-Korkie-Memmel (JKM) Test of Equality in Keyword Portfolio Performance.
| Industries | BP1 | BP2 | BP3 | BP4 | BP5 |
|---|---|---|---|---|---|
| Advertising Services | 4.8422∗∗∗ | 1.6757∗∗ | 2.4485∗∗∗ | 2.0455∗∗ | 1.9131∗∗ |
| Beauty | 2.7484∗∗∗ | 2.8752∗∗∗ | 2.1823∗∗ | 2.9758∗∗∗ | 3.0244∗∗∗ |
| Consumer Electronics | 2.4464∗∗∗ | 1.9929∗∗ | 2.2830∗∗ | 2.1094∗∗ | 2.1512∗∗ |
| Fashion & Style | 2.9496∗∗∗ | 3.5775∗∗∗ | 2.2475∗∗ | 3.5791∗∗∗ | 3.9049∗∗∗ |
| Finance | 2.2901∗∗∗ | 2.1188∗∗ | 2.1767∗∗ | 2.3549∗∗∗ | 2.2383∗∗ |
| Health | 3.6804∗∗∗ | 2.4931∗∗∗ | 2.6721∗∗∗ | 2.8962∗∗∗ | 2.8336∗∗∗ |
| Hobbies & Leisure | 4.5683∗∗∗ | 4.6350∗∗∗ | 4.5418∗∗∗ | 4.8197∗∗∗ | 4.8203∗∗∗ |
| Home Appliances | 3.5620∗∗∗ | 3.8766∗∗∗ | 3.6351∗∗∗ | 3.9860∗∗∗ | 3.8993∗∗∗ |
| Internet | 2.6451∗∗∗ | 3.2713∗∗∗ | 2.9289∗∗∗ | 3.5482∗∗∗ | 3.3631∗∗∗ |
| Internet & Telecommunications | 1.8224∗∗ | 1.3919∗ | 1.4580∗ | 1.7340∗∗ | 1.6680∗∗ |
| Management Consulting | 1.7415∗∗ | 1.8882∗∗ | 1.7282∗∗ | 1.8826∗∗ | 1.8821∗∗ |
| Motor Vehicles | 4.3523∗∗∗ | 3.6332∗∗∗ | 3.2245∗∗∗ | 3.8899∗∗∗ | 3.9241∗∗∗ |
| Real Estate | 3.0348∗∗∗ | 3.0006∗∗∗ | 2.6418∗∗∗ | 3.0228∗∗∗ | 3.0220∗∗∗ |
| Social Network | 2.8931∗∗∗ | 2.8545∗∗∗ | 2.6941∗∗∗ | 2.8681∗∗∗ | 3.0779∗∗∗ |
| Travel & Tourism | 3.8972∗∗∗ | 3.3200∗∗∗ | 3.0526∗∗∗ | 3.4447∗∗∗ | 3.4578∗∗∗ |
Note: This table presents the test statistics of the parametric JKM test of Jobson & Korkie (1981) and Memmel (2003). The null hypothesis is that there is no difference in the Sharpe ratio of the benchmark portfolio and that of the corresponding portfolio on the efficient frontier for the same level of risk. ∗∗∗, ∗∗, ∗ denote the 1%, 5% and 10% level of significance respectively.
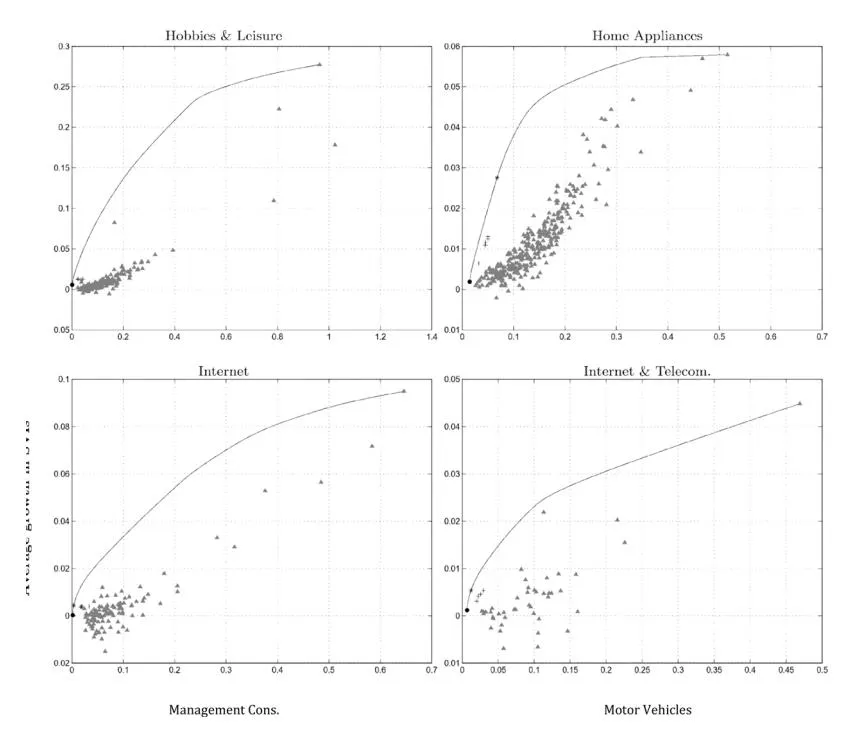
Fig. 2b. Efficient Keyword Frontiers and Alternative Keyword Selection Strategies Note: The figures display the risk (standard deviation in popularity growth) on the horizontal axis and the expected return (average popularity growth) on the vertical axis. Solid lines represent efficient keyword frontiers, filled circles and stars correspond to the minimum variance and the maximum Sharpe ratio portfolios, respectively. Crosses represent the five benchmark portfolios while triangles correspond to individual keywords.
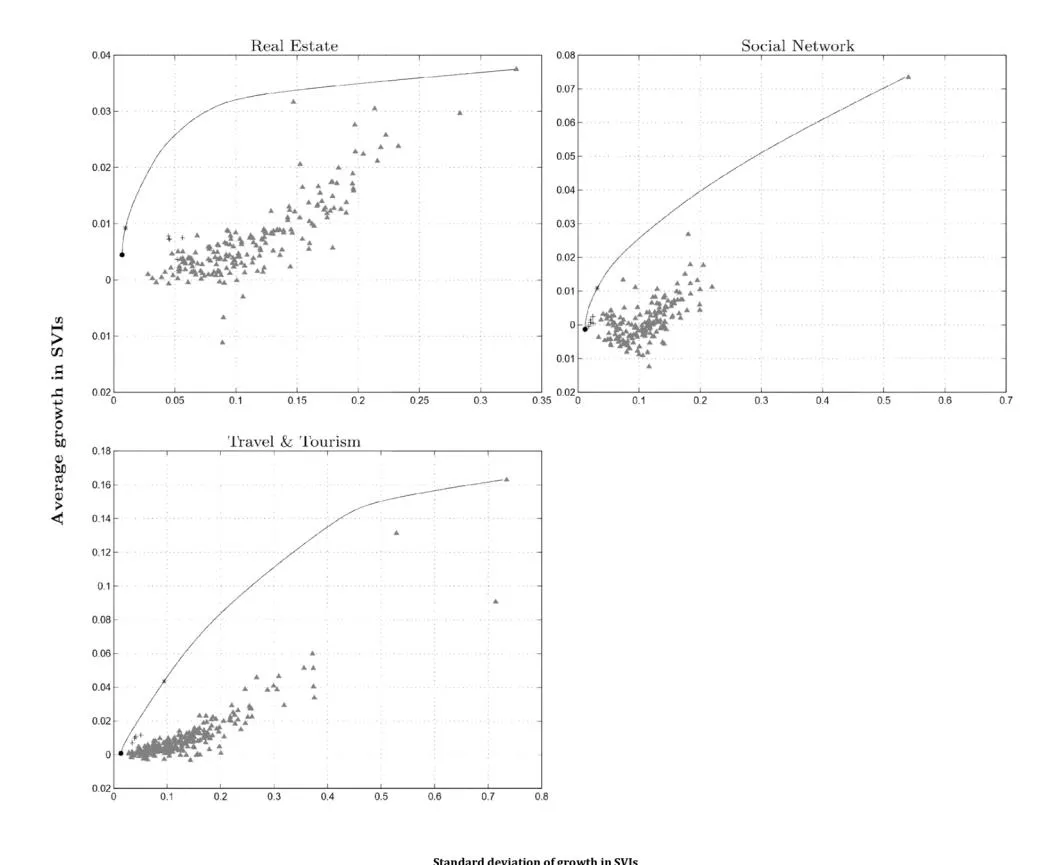
Fig. 2c. Efficient Keyword Frontiers and Alternative Keyword Selection Strategies Note: The figures display the risk (standard deviation in popularity growth) on the horizontal axis and the expected return (average popularity growth) on the vertical axis. Solid lines represent efficient keyword frontiers, filled circles and stars correspond to the minimum variance and the maximum Sharpe ratio portfolios, respectively. Crosses represent the five benchmark portfolios while triangles correspond to individual keywords.
Table 6 Ledoit-Wolf test of Equality in Keyword Portfolio Performance .
| Industries | BP1 | BP2 | BP3 | BP4 | BP5 |
|---|---|---|---|---|---|
| Advertising Services | 4.5056∗∗∗ | 1.8376∗ | 2.3547∗ | 2.2525∗ | 2.0948∗ |
| Beauty | 2.8219∗∗∗ | 2.0308 | 2.4928∗∗ | 2.0818∗ | 2.0516∗ |
| Consumer Electronics | 2.4385 | 2.0344∗ | 2.2054 | 1.9041 | 1.9617 |
| Fashion & Style | 4.1661∗∗∗ | 3.2311∗∗ | 2.2244∗∗ | 3.2431∗∗∗ | 3.5441∗∗ |
| Finance | 2.1782∗∗ | 2.3731∗∗ | 2.5669∗∗ | 2.6380∗∗ | 2.4738∗∗ |
| Health | 4.9077∗∗∗ | 2.8672∗∗ | 3.0992∗∗ | 3.3796∗∗ | 3.2557∗∗ |
| Hobbies & Leisure | 7.1820∗∗∗ | 4.8658∗∗ | 4.4939∗ | 5.0241∗∗ | 5.0522∗∗∗ |
| Home Appliances | 4.2714∗∗∗ | 3.8445∗∗∗ | 4.2266∗∗∗ | 4.1349∗∗∗ | 4.0043∗∗∗ |
| Internet | 3.2108∗∗∗ | 4.0288∗∗∗ | 3.8643∗∗∗ | 4.7325∗∗∗ | 3.9445∗∗∗ |
| Internet & Telecommunications | 1.8430∗ | 1.6566 | 1.6317 | 1.9905∗∗ | 1.7589∗ |
| Management Consulting | 1.8694 | 1.9809 | 2.0788 | 1.9187 | 1.9295 |
| Motor Vehicles | 6.1408∗∗∗ | 4.6208∗∗∗ | 4.6615∗∗∗ | 4.8623∗∗∗ | 4.9024∗∗∗ |
| Real Estate | 3.2947∗∗∗ | 3.0328∗∗∗ | 2.8037∗∗ | 3.0700∗∗∗ | 3.1033∗∗∗ |
| Social Network | 4.2129∗∗∗ | 3.7709∗∗∗ | 4.2725∗∗∗ | 4.0037∗∗∗ | 3.2714∗∗∗ |
| Travel & Tourism | 3.7406∗∗∗ | 2.7050∗∗ | 2.5325∗∗ | 2.9978∗∗ | 3.0163∗∗ |
Note: This table presents the non-parametric test statistics of Ledoit & Wolf (2008). The null hypothesis is that there is no difference in the Sharpe ratio of the benchmark portfolio and that of the portfolio on the efficient frontier for the same level of risk. The standard errors of the test are estimated via bootstrap. ∗∗∗, ∗∗, ∗ denote the 1%, 5% and 10% level of significance respectively.
The application of portfolio optimization to search advertising can build on the extensive relevant experience that has accumulated in the financial industry and academic research. For example, the proposed approach needs to be adjusted if the number of keywords considered is very large and exceeds the sample length of the time series for growth rates in search intensity. Under these circumstances, standard quadratic programming methods cannot solve the portfolio optimization problem. This is because the sample covariance matrix in Eq. (15) becomes singular, which means that the inverse of the sample covariance matrix cannot be obtained. This is a common problem in financial portfolio optimization as there are over 2400 stocks listed only on the New York Stock Exchange (NYSE), while the number of observations typically used does not exceed 1200 months using a century of data. Although the population of keywords may not be that large in advertising, sample sizes will be smaller as this is a relatively new development. The financial industry and academic researchers have developed effective solutions to this problem. The most widely used approach is that of Ledoit & Wolf (2004). They propose shrinkage estimators of covariance matrix based on an optimally weighted average of the sample covariance matrix and the single-index covariance matrix.
Another potentially useful practice from the financial industry is the use of Sharpe ratios to evaluate risk-adjusted performance of individual keywords in search advertising. These could be calculated as the average growth rate in SVIs over the standard deviation of growth rates. Financial practitioners use these as a way to evaluate portfolios and communicate information. Risk-adjusted measures such as the Sharpe ratio can also be used as a”quick and dirty” way for portfolio optimization (e.g., see Jacobs, Müller, & Weber, 2014; Rachev, Jašic, ´ Stoyanov, & Fabozzi, 2007). For example, the investment bank Goldman Sachs has launched an investment fund which consists of 50 stocks with the highest projected Sharpe ratio (see SEC filing on Goldman Sachs High Sharpe Ratio ETF, 2016). Building keyword portfolios on the basis of Sharpe ratios has two serious limitations compared to the optimization approach described previously. First, it cannot provide the optimal solution as it does not account for the effect of correlation between keywords. Second, it cannot accommodate differences in terms of advertiser risk preferences as it provides a single portfolio rather than a frontier. However, given its simplicity it may appeal to less sophisticated advertisers with very limited resources. It may also have some use when communicating results or for real-time decision support systems.
To demonstrate and empirically assess the usefulness of this “Sharpe Ratio Heuristic” approach for search advertising, equally-
Table 7 Jobson-Korkie-Memmel (JKM) Test of Equality in Keyword Portfolio Performance for Portfolio Based on Sharpe Ratio Heuristic .
| Industries | EW10P | EW20P | EW30P |
|---|---|---|---|
| Advertising Services | 0.7051 | 0.8667 | 0.9801 |
| Beauty | 0.9195 | 1.0872 | 1.3558∗ |
| Consumer Electronics | 0.7835 | 1.0242 | 1.1907 |
| Fashion & Style | 0.6123 | 0.7021 | 1.1022 |
| Finance | 0.9192 | 1.0869 | 1.3548∗ |
| Health | 0.4863 | 1.1145 | 1.4040∗ |
| Hobbies & Leisure | 1.2145 | 1.8841∗∗ | 2.3394∗∗∗ |
| Home Appliances | 1.4685∗ | 1.8943∗∗ | 2.5109∗∗∗ |
| Internet | 0.5346 | 1.0666 | 1.5503∗ |
| Internet & Telecommunications | 0.4494 | 0.8384 | 1.1299 |
| Management Consulting | 0.9409 | 0.9868 | 1.1281 |
| Motor Vehicles | 0.9952 | 1.6866∗∗ | 1.7157∗∗ |
| Real Estate | 0.6261 | 0.9757 | 1.4866∗ |
| Social Network | 0.5582 | 0.8295 | 1.1407 |
| Travel & Tourism | 1.2863∗ | 1.4031∗ | 1.3268∗ |
Note: This table presents the test statistics of the JKM parametric test. The null hypothesis is that there is no difference in the Sharpe ratio of two portfolios built under the Sharpe Ratio heuristic and the portfolio on the efficient frontier at the same level of risk. EW10P, EW20P and EW30P invests equally in 10, 20 and 30 keywords, respectively with the highest Sharpe Ratio. ∗∗∗, ∗∗, ∗ denote the 1%, 5% and 10% level of significance respectively.
weighted portfolios are built using the keywords with the 10 largest Sharpe ratios for each one of the sectors considered. The portfolio size choice is based on research findings in the financial literature which show that diversification benefits are marginal for portfolios that are larger than 10 assets (Evans & Archer, 1968).
A simple graphical comparison, as shown in Fig. 3, suggests small differences in performance against the corresponding portfolio on the frontier. However, as noted previously, this portfolio will not satisfy investors that have a higher or lower appetite for risk. As before, the statistical differences in Sharpe ratios are computed using the JKM parametric test. The results in Table 7 indicate that the differences in performance are statistically insignificant at the five percent level. Evans & Archer (1968), Elton & Gruber (1977), and Statman (1987), find that the marginal returns to diversification become insignificant only for portfolio sizes larger than 30 assets. In order to account for the possibility that larger portfolios have a significantly better performance, the analysis is repeated using the proposed heuristic using portfolios of 20 and 30 keywords, respectively. The results, presented in the last two columns of Table 7, suggest that the larger portfolios have comparable performance.
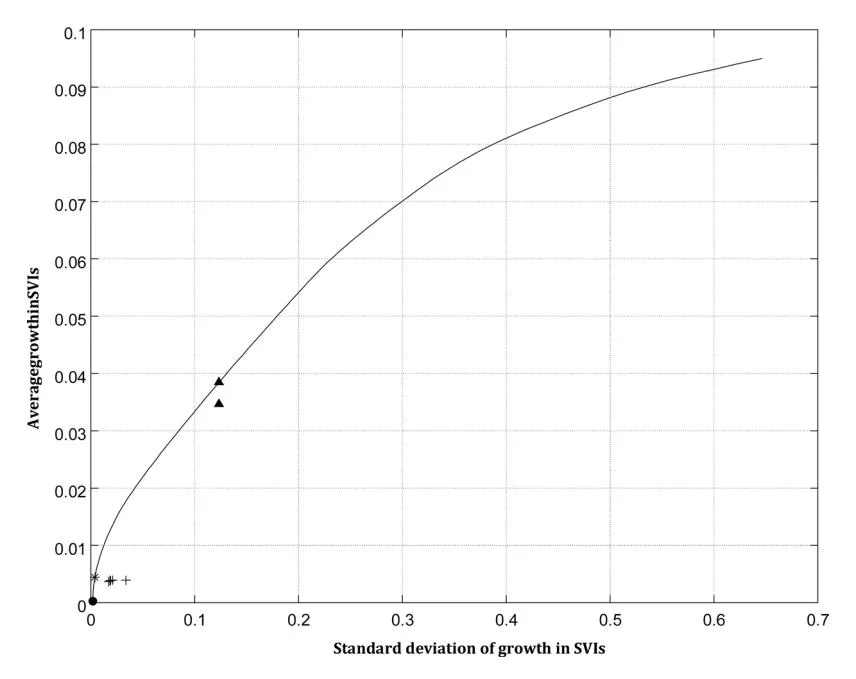
Fig. 3. Sharpe Ratio Heuristic of Keyword Risk-Adjusted Performance for the Internet sector Note: This figure displays the risk (standard deviation in popularity growth) on the x axis and the expected return (average popularity growth) on the y axis for the Internet sector. The solid line is the efficient keyword frontier, the filled circle and the star are the minimum variance and the maximum Sharpe ratio portfolios on the efficient frontiers, the crosses are the five benchmark portfolios and the triangles are the Sharpe ratio heuristic portfolio and the efficient portfolio for the respective level of risk.
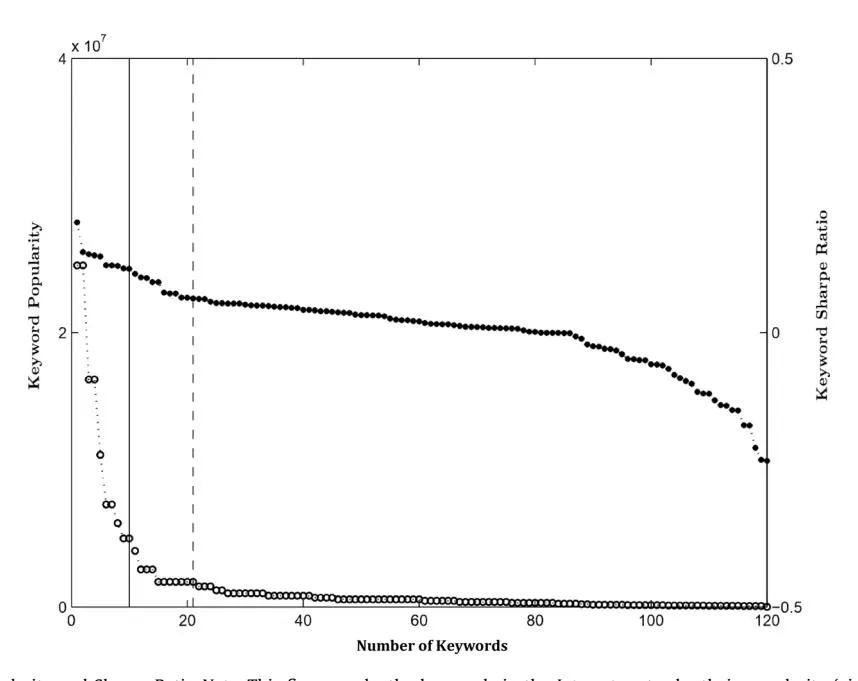
Fig. 4. Rank of Keywords by Popularity and Sharpe Ratio Note: This figure ranks the keywords in the Internet sector by their popularity (circles, left y axis) and their Sharpe ratio (filled circles, right y axis). The vertical dotted line separates head from long tail keywords while the vertical solid line demonstrates the 10 keywords with the highest Sharpe ratio.
Figure 4 sheds more light on the distribution of the values for the proposed heuristic, through the ranking of keywords by Sharpe ratio for the Internet sector. The figure includes an overlay of the long tail curve, which is popular amongst practitioners as a tool on deciding between keywords (see Skiera et al., 2010). The figure also includes the cut-off point for: the 10 keywords with the largest Sharpe ratio value, and the keywords with above average popularity (so-called head). The curve of Sharpe ratio values is much flatter and has less extremes compared to the ranking of keywords based on popularity alone.
4. Discussion and conclusions
Section titled “4. Discussion and conclusions”This paper proposes a new framework for supporting advertisers’ decision making on how to allocate funds among keywords for search advertising. It has significant theoretical implications as it adapts the Markowitz approach, one of the most widely used frameworks in OR. Although Markowitz theory has been previously employed in marketing and advertising, it has not been considered before in the context of online search advertising. Current approaches to this problem are mostly ad hoc, and lack theoretical foundations and reasoning. This paper places search advertising for the first time within a solid theoretical framework and links it to a well-researched literature. This allows to generate new research questions along with testable hypotheses.
The paper has also considerable implications for OR practitioners in online advertising, as it develops an implementation of the proposed approach that uses readily available data from Google Trends. This is an important innovation, as the application of the Markowitz approach in marketing has been limited due to the difficulties of obtaining the necessary data. The nature of the proposed implementation and data mean that it is possible to develop a software system which can provide real-time decision support.6 In order to further facilitate implementation, we consider problems along with possible solutions related to sample size and method simplifications using heuristics.
An empirical study uses search advertising data from 15 major sectors and provides evidence that the proposed approach has superior performance compared to heuristic rules that are popular amongst practitioners. While the empirical findings support the use of the proposed approach, the theoretical foundation allows an intuitive explanation of the results and optimal strategies. In particular, practitioners are encouraged to consider the risk-adjusted performance of keywords by diversifying advertising budget across unrelated keywords. The proposed approach is particularly relevant for the rapidly changing post-pandemic environment, as it relies on search engine intensity data that are sensitive to changes to online behaviour.
Future research should deal with some of the limitations of this paper. The extensive literature on Markowitz portfolio theory in OR, finance and other disciplines can be used to draw extensions and alternatives to what is proposed. Although the focus is on the mean and variance, additional moments may also be important. Extensions to the standard Markowitz approach could be used to consider the effect of skewness and kurtosis. The empirical investigation was in sample and did not include all the different methodologies of implementing portfolio optimisation. A horserace could be implemented to compare the out-of-sample performance of alternative approaches.
Supplementary material
Section titled “Supplementary material”Supplementary material associated with this article can be found, in the online version, at doi:10.1016/j.ejor.2022.03.006.
References
Section titled “References”-
Abou Nabout, N., Lilienthal, M., & Skiera, B. (2014). Empirical generalizations in search engine advertising. Journal of Retailing, 90(2), 206–216.
-
Bartram, S. M., Brown, G. W., & Fehle, F. R. (2009). International evidence on financial derivatives usage. Financial Management, 38(1), 185–206.
-
Bickel, J. E. (2006). Some determinants of corporate risk aversion. Decision Analysis, 3(4), 233–251.
-
Borgs, C., Chayes, J., Immorlica, N., Jain, K., Etesami, O., & Mahdian, M. (2007). Dynamics of Bid Optimization in Online Advertisement Auctions. In Proceedings of the 16th international conference on world wide web. ACM, Banff, Alberta, Canada, 531–540.
-
Brick, I. E., & Jagpal, H. S. (1984). Utility theory, value maximization and the quality decision under uncertainty. International Economic Review, 25(2), 369–377.
-
Cardozo, R. N., & Smith Jr, D. K. (1983). Applying financial portfolio theory to product portfolio decisions: An empirical study. Journal of Marketing, 47(2), 110–119.
-
Cardozo, R. N., & Smith Jr, D. K. (1985). On the use of financial portfolio theory in marketing decisions: A reply to devinney, stewart, and shocker. Journal of Marketing, 49(4), 113–115.
-
Copeland, P., Romano, R., Zhang, T., Hecht, G., Zigmond, D., & Stefansen, C. (2013). Google disease trends: An update. Nature, 457, 1012–1014.
-
6 There exists a number of commercially available systems for digital advertising management. To the best of our knowledge, none of these make a provision for managing portfolio risk-adjusted keyword performance. However, they could be modified in order to provide this capability on the basis of the suggestions made in this paper.
-
Cottle, R. W., & Dantzig, G. B. (1968). Complementary pivot theory of mathematical programming. Linear Algebra and its Applications, 1(1), 103–125.
-
Da, Z., Engelberg, J., & Gao, P. (2011). In search of attention. Journal of Finance, 66(5), 1461–1499.
-
De Kluyver, C., & Baird, F. (1984). Media selection by mean-variance analysis. European Journal of Operational Research, 16(2), 152–156.
-
DeMiguel, V., Garlappi, L., & Uppal, R. (2009). Optimal versus naive diversification: How inefficient is the 1/n portfolio strategy? Review of Financial Studies, 22(5), 1915–1953.
-
Desai, P. S., Shin, W., & Staelin, R. (2014). The company that you keep: When to buy a competitor’s keyword. Marketing Science, 33(4), 485–508.
-
Devinney, T. M., Stewart, D. W., & Shocker, A. D. (1985). A note on the application of portfolio theory: Acomment on cardozo and smith. Journal of Marketing, 49(4), 107–112.
-
Dhar, V., & Ghose, A. (2010). Research commentary-Sponsored search and market efficiency. Information Systems Research, 21(4), 760–772.
-
Dugas, A. F., Jalalpour, M., Gel, Y., Levin, S., Torcaso, F., Igusa, T., & Rothman, R. E. (2013). Influenza forecasting with google flu trends. PloS one, 8(2), e56176.
-
Edelman, B. G., Ostrovsky, M., & Schwarz, M. (2005). Internet advertising and the generalized second price auction: Selling billions of dollars worth of keywords. American Economic Review, 97(1), 242–259.
-
Elton, E. J., & Gruber, M. J. (1977). Risk reduction and portfolio size: An analytical solution. Journal of Business, 50(4), 415–437.
-
Evans, J. L., & Archer, S. H. (1968). Diversification and the reduction of dispersion: An empirical analysis. Journal of Finance, 23(5), 761–767.
-
Ghose, A., & Yang, S. (2009). An empirical analysis of search engine advertising: sponsored search in electronic markets. Management Science, 55(10), 1605–1622.
-
Goel, S., Hofman, J. M., Lahaie, S., Pennock, D. M., & Watts, D. J. (2010). Predicting consumer behavior with web search. Proceedings of the National Academy of Sciences of the United States of America, 107(41), 17486–17490.
-
Gönsch, J. (2017). A survey on risk-averse and robust revenue management. European Journal of Operational Research, 263(2), 337–348.
-
Holthausen Jr, D. M., & Assmus, G. (1982). Advertising budget allocation under uncertainty. Management Science, 28(5), 487–499.
-
Howton, S. D., & Perfect, S. B. (1998). Managerial compensation and firm derivative usage: an empirical analysis. Journal of Derivatives, 6(2), 53–64.
-
Jacobs, H., Müller, S., & Weber, M. (2014). How should individual investors diversify? an empirical evaluation of alternative asset allocation policies. Journal of Financial Markets, 19(3), 62–85.
-
Jagpal, H. S., & Brick, I. E. (1982). The marketing mix decision under uncertainty. Marketing Science, 1(1), 79–92.
-
Jagpal, S., et al. (2008). Fusion for profit: How marketing and finance can work together to create value. New York: Oxford University Press.
-
Jang, S., Kim, A. J., & Yoon, J. (2021). Multiple keywords management in sponsored search advertising with interrelated consumer clicks. Journal of Business Research (In press).
-
Jerath, K., Ma, L., & Park, Y.-H. (2014). Consumer click behavior at a search engine: The role of keyword popularity. Journal of Marketing Research, 51(4), 480–486.
-
Jobson, J. D., & Korkie, B. M. (1981). Performance hypothesis testing with the sharpe and treynor measures. Journal of Finance, 36(4), 889–908.
-
Joo, M., Wilbur, K. C., Cowgill, B., & Zhu, Y. (2013). Television advertising and online search. Management Science, 60(1), 56–73.
-
Kim, A. J., Jang, S., & Shin, H. S. (2021). How should retail advertisers manage multiple keywords in paid search advertising? Journal of Business Research, 130(3), 539–551.
-
Köhler, C., Mantrala, M. K., Albers, S., & Kanuri, V. K. (2017). A meta-Analysis of marketing communication carryover effects. Journal of Marketing Research, 54(6), 990–1008.
-
Ledoit, O., & Wolf, M. (2004). Honey, i shrunk the sample covariance matrix. Journal of Portfolio Management, 30(4), 110–119.
-
Ledoit, O., & Wolf, M. (2008). Robust performance hypothesis testing with the sharpe ratio. Journal of Empirical Finance, 15(5), 850–859.
-
Ledoit, O., & Wolf, M. (2011). Robust performances hypothesis testing with the variance. Wilmott Magazine, September, 85–89.
-
Ledoit, O., & Wolf, M. (2018). Robust performance hypothesis testing with smooth functions of population moments. Working Paper, No. 305. University of Zurich.
-
Li, X., Qi, X., & Li, Y. (2021). On sales effort and pricing decisions under alternative risk criteria. European Journal of Operational Research (Forthcoming).
-
Mantrala, M. K. (2002). In Barton A. Weitz, & Robin Wensley (Eds.), “Allocating Marketing Resources,” Ch. 16 in Handbook of Marketing. Thousand Oaks, CA: Sage Publications.
-
Markowitz, H. (1952). Portfolio selection∗. Journal of Finance, 7(1), 77–91.
-
Memmel, C. (2003). Performance hypothesis testing with the sharpe ratio. Finance Letters, 1(1), 21–23.
-
Nikolopoulos, K., Punia, S., Schäfers, A., Tsinopoulos, C., & Vasilakis, C. (2020). Forecasting and planning during a pandemic: Covid-19 growth rates, supply chain disruptions, and governmental decisions. European Journal of Operational Research, 290(1), 99–115.
-
Rachev, S., Jašic, ´ T., Stoyanov, S., & Fabozzi, F. J. (2007). Momentum strategies based on reward–risk stock selection criteria. Journal of Banking & Finance, 31(8), 2325–2346.
-
Rawls, S. W., & Smithson, C. W. (1990). Strategic risk management. Journal of Applied Corporate Finance, 2(4), 6–18.
-
Rusmevichientong, P., & Williamson, D. P. (2006). An adaptive algorithm for select-
-
ing profitable keywords for search-Based advertising services. Proceedings of the 7th ACM Conference on Electronic Commerce. ACM, 260–269
-
Rutz, O. J., & Bucklin, R. E. (2007). A model of individual keyword performance in paid search advertising. Working Paper, Yale University, New Haven, CT.
-
Rutz, O. J., Trusov, M., & Bucklin, R. E. (2011). Modeling indirect effects of paid search advertising: Which keywords lead to more future visits? Marketing Science, 30(4), 646–665.
-
Ryals, L., Dias, S., & Berger, M. (2007). Optimising marketing spend: Return maximisation and risk minimisation in the marketing portfolio. Journal of Marketing Management, 23(9–10), 991–1011.
-
Selçuk, B., & Özlük, Ö. (2013). Optimal keyword bidding in search-based advertising with target exposure levels. European Journal of Operational Research, 226(1), 163–172.
-
Skiera, B., Eckert, J., & Hinz, O. (2010). An analysis of the importance of the long tail in search engine marketing. Electronic Commerce Research and Applications, 9(6), 488–494.
-
Statman, M. (1987). How many stocks make a diversified portfolio? Journal of Financial and Quantitative Analysis, 22(03), 353–363.
-
Tunuguntla, V., Basu, P., Rakshit, K., & Ghosh, D. (2019). Sponsored search advertising and dynamic pricing for perishable products under inventory-linked customer willingness to pay. European Journal of Operational Research, 276(1), 119–132.
-
Vlastakis, N., & Markellos, R. N. (2012). Information demand and stock market volatility. Journal of Banking & Finance, 36(6), 1808–1821.
-
Vosen, S., & Schmidt, T. (2011). Forecasting private consumption: Survey-based indicators vs. google trends. Journal of Forecasting, 30(6), 565–578.
-
Wu, L., & Brynjolfsson, E. (2015). The future of prediction: How google searches foreshadow housing prices and sales. University of Chicago Press, 89–118.
-
Xu, L., Duan, J. A., & Whinston, A. (2014). Path to purchase: A Mutually exciting point process model for online advertising and conversion. Management Science, 60(6), 1392–1412.
-
Yang, W., Xiao, B., & Wu, L. (2020). Learning and pricing models for repeated generalized second-price auction in search advertising. European Journal of Operational Research, 282(2), 696–711.
-
Zhang, D., & Lu, J. (2009). Batch-Mode Computational Advertising Based on Modern Portfolio Theory. In Azzopardi, l., kazai, g., robertson, s., rȭger, s., shokouhi, m., song, d., yilmaz, e. (eds.) ictir 2009. lncs, advances in information retrieval theory. Springer, 5766, 380–383.
-
Zigmond, D., & Stipp, H. (2010). Assessing a new advertising effect. Journal of Advertising Research, 50(2), 162–168.
-
Zopounidis, C., Doumpos, M., & Fabozzi, F. J. (2014). Preface to the special issue: 60 years following harry Markowitz’s contributions in portfolio theory and operations research. European Journal of Operational Research, 2(234), 343–345.