Optimizing Sentiment Analysis In Product Descriptions
Abstract
Section titled “Abstract”This study investigates the role of product descriptions in reducing information asymmetry on e-commerce platforms, particularly for high-priced items. Utilizing a text analytic approach, we employ a novelty method called “SATORE,” where we used the Latent Dirichlet Allocation (LDA) model to extract topics and determine the optimal number using the Renyi Entropy technique. Sentiment scores were calculated based on the topic information for each product and integrated into a logistic regression model to assess their influence on buyers’ purchase intentions. The results indicate that the sentiment score calculated by SATORE significantly affects purchase intention and helps reduce information asymmetry. The effects of sentiment scores vary with product prices, with higher-priced items having a more substantial impact. In addition, our method proves to be more robust than word-frequency-based sentiment scores, which lose significance when prices exceed ¥100,000. These findings benefit platform owners by helping them maintain improved buyer-seller relationships.
Keywords SATORE · Information asymmetry · Sentiment score · Purchase intention · E-commerce · Renyi entropy
1 Introduction
Section titled “1 Introduction”Customer-to-customer (C2C) platforms, especially e-commerce marketplaces for second-hand goods, have experienced a significant increase in consumer traffic, particularly influenced by changes in purchasing behavior during the COVID-19 pandemic [1]. The pandemic prompted many consumers to turn to online platforms for essential and scarce goods, such as face masks, which are difficult to find in physical stores [1]. The shortage of these items allowed sellers to charge premium prices, capitalizing on their limited availability and collectible value.
C2C platforms must prioritize maintaining trust between consumers and the platform itself to meet the demands of a growing consumer base [2, 3]. One of the key challenges
Yi Sun sun-yi650@g.ecc.u-tokyo.ac.jp; sunyi7331@gmail.com Kaira Sekiguchi kaira@sys.t.u-tokyo.ac.jp Yukio Ohsawa ohsawa@sys.t.u-tokyo.ac.jp
1 Department of Systems Innovation, School of Engineering, The University of Tokyo, Tokyo, Japan
in establishing and preserving this trust is managing the information asymmetry between buyers and sellers on these platforms [4]. In the digital marketplace setting, sellers typically have complete product information. By contrast, buyers must rely on the information the seller provides and other buyers, known as signals (such as reviews and ratings), to make purchasing decisions [5]. This phenomenon is called information asymmetry and is even more pronounced in high-value product categories. Prior research emphasizes the importance of reducing information asymmetry to facilitate informed purchasing decisions and successful transactions on e-commerce platforms, particularly in high-value transactions [2, 4]. Thus, understanding how signals reduce this asymmetry, especially in the context of high-value items, is critically important [5–7].
The signaling theory provides a framework for understanding how hard and soft signals help mitigate information asymmetry. Hard signals (e.g., reviews and ratings) are easily quantifiable. By contrast, soft signals (e.g., the emotional content of product descriptions) are more subjective and less studied in the context of high-value transactions [5, 8]. While extensive research has been conducted on hard signals in e-commerce, there is a gap in understanding the role of soft signals, particularly in high-stakes transactions,
where emotional engagement can mitigate perceived risks [8, 9].
This study hypothesizes that hard and soft signals play critical roles in influencing buyer behavior, particularly in high-value transactions where emotional investment and perceived risk are heightened. Hard signals such as product ratings and reviews provide concrete evidence of product popularity and quality, making them more quantifiable. By contrast, soft signals, such as emotionally rich product descriptions, offer subtle points and more subjective cues that sway buyer perceptions and reduce uncertainty. This study explores how emotionally rich product descriptions interact with other signals to influence purchase decisions, a relatively under-researched area in C2C platforms, by focusing on high-value items. Our research question is how hard and soft signals affect purchase intentions for highvalue items on C2C platforms. By analyzing a dataset of over 4.4 million product descriptions and associated sales data from Mercari, one of Japan’s largest C2C platforms, this analysis allows us to investigate the nuanced relationship between context-sensitive emotional content in product descriptions and purchase decisions, alongside the role of other hard signals.
Sun and Ohsawa (2022) explored the impact of product descriptions on transaction success rates using topic modeling and Renyi entropy, focusing primarily on uncovering topic structures within descriptions. Their study highlighted the role of descriptive topics in shaping buyer trust but did not delve deeply into context-sensitive emotional content [10]. Expanding on this foundation, Sun, Sekiguchi, and Ohsawa (2024) introduced sentiment scoring based on word frequencies in product descriptions. They discovered positive sentiment correlated with higher transaction success, although this relationship became insignificant for products priced above ¥100,000 [11].
Specifically, our study utilized Renyi entropy to determine the optimal number of topics, which can also be considered a mechanism that captures the complex relationship between emotional content and cognitive recognition within product descriptions. By minimizing Renyi entropy, we identify the most informative topic structure, which allows us to dynamically adjust to shifts between emotional cues and cognitive elements, such as product quality and perceived value. This approach significantly improves over traditional word frequency methods by providing a more context-sensitive analysis that captures the detailed interplay between sentiment and recognition across all price ranges, particularly in high-value transactions [11]. For clarity, this methodology, which combines sentiment analysis with topic modeling and Renyi entropy, is hereafter referred to as “SATORE.”
By applying this advanced methodology to a large Mercari dataset, we gained new insights into consumer behavior across varying price tiers. Our findings demonstrate that while context-sensitive emotional content has a stronger influence on purchase decisions as product prices increase, it remains a relevant factor across all price ranges that reinforces the broader utility of our approach in interpreting consumer decision-making processes on C2C platforms, particularly where emotional engagement plays a critical role.
This study highlights the crucial role of context-sensitive emotional content in product descriptions and reviews on C2C platforms. While the Elaboration Likelihood Model (ELM) [12] provides a valuable framework for analyzing how persuasive communications are processed, it primarily focuses on long-term attitude changes and how deep cognitive processing shapes them over time. However, our study addresses a different aspect of consumer behavior: the immediate influence of context-sensitive emotional content in product descriptions and information, such as likes, prices, and comments from products, on purchase intentions under conditions of information asymmetry. Whereas ELM emphasizes the continuing process of persuasion and attitude change, signaling theory provides a framework for understanding how buyers rely on immediate cues (hard and soft signals) to navigate uncertainty in C2C settings when direct information is limited. ELM addresses this aspect. In particular, soft signals are crucial in high-value transactions, where stakes are higher, and emotional engagement helps reduce the perceived risk and uncertainty. By focusing on the buyer’s decision-making process, our study demonstrates how soft signals influence purchase intentions, a process that contrasts with the attitude shifts commonly examined under the ELM. Building on these foundations, this study examines how hard and soft signals influence consumer behavior in high-value transactions, an underexplored area in existing research.
The remainder of this paper is organized as follows. Chapter 2 presents the development of the information asymmetry and signaling theory and its applications in the C2C and e-commerce domains. We also introduce the application of the Latent Dirichlet Allocation model (LDA) and Renyi Entropy in the business domain [13]. Based on prior research findings, we present the framework and hypotheses of this study in Chap. 3. Chapter 4 explains the data and methodology used in this study to prove these hypotheses. The experimental results are presented in Chap. 5. Finally, Chap. 6 concludes the paper with a summary and discussion of the contributions and implications of the findings.
2 Literature review and conceptual framework
Section titled “2 Literature review and conceptual framework”This study draws on research in three areas: (1) signaling theory and its impact on product sales, (2) the impact of text information on product sales, and (3) text analysis methods.
2.1 Signaling theory and its impact on product sales
Section titled “2.1 Signaling theory and its impact on product sales”E-commerce transactions typically involve three key stakeholders: the platform, the seller, and the buyer. An imbalance in the information accessible to these stakeholders, commonly called information asymmetry, can complicate decision-making. Signaling theory addresses this imbalance and focuses on various signals communicating the sender’s characteristics and intentions [5–7, 14].
Signals in e-commerce are characterized by observability and cost [5]. Observability refers to how noticeable the signal is to outsiders, such as potential buyers, whereas signal cost refers to the effort or resources required to produce the signal [5]. For example, research has shown that higher website quality, as a signal, increases trust and purchase intention, particularly in high-value transactions. Thus, they rely on quality signals to perceive the quality of a product [6, 15, 16]. If sellers can send quality signals, the information will help buyers reduce information asymmetry and build trust, leading to purchase intention. For instance, Gregg and Walczak (2010) demonstrate that, as a signal, the higher website quality, the greater the likelihood of trust, purchase intention, and price premium sellers will receive from potential buyers [6].
Signals can be roughly divided into hard and soft signals. Hard signals are information that can be easily summarized and recorded as numbers [8]. For example, one of the classical hard information signals is the seller’s reputation system, which includes reputation scores, star ratings, and recommendations from the platform [17]. Many prior studies on social media have suggested that hard information, such as the number of likes and comments, is also an indicator of a post’s popularity. For example, in a study on Facebook sales, Lee et al. (2015) found that the number of likes on Facebook posts positively affects the sale of products because the number of likes can change potential consumers’ attitudes [18]. Chang et al. (2020) suggested that sellers should aim to increase the number of likes, comments, and shares on Facebook’s second-hand marketplace. The higher these values, the greater the popularity of the post, which can convince consumers that the post represents a good source for buying the product [19].
By contrast, soft information refers to qualitative data that require context for interpretation, such as online reviews and product descriptions [8]. Some studies have demonstrated that positive reviews can significantly influence product sales by enhancing consumer trust and reducing perceived risk [20–22]. Overall, the more accurate and complete the signal a seller can provide, the more positively it can influence the construction of trust [2].
2.2 The impact of soft information signals on product sales
Section titled “2.2 The impact of soft information signals on product sales”In the past, most research on the signaling of soft information focused on online reviews. However, these findings have been inconsistent. The impact of online reviews on box office sales varies across studies, even for the same product category, such as movie tickets. Some studies showed a positive trend, whereas others showed no significance [23, 24]. Kim (2021) suggested that the content of online reviews influences customers’ purchase decisions [25]. However, other signals alter the degree of influence because when customers can obtain other signals that help reduce uncertainty about product quality, they rely less on online reviews, thereby reducing the influence of online reviews on customers. This study explains the contradictions in past research on the effects of online reviews [25].
On the other hand, as a type of soft information signal, textual information in product descriptions has received little attention outside the crowdfunding field. Zhou et al. (2018) studied project descriptions on crowdfunding websites and identified three key signals: length, readability, and tone. These signals improve the accuracy of the project success prediction models and significantly affect the success rates [26]. Jiang et al. (2020) also stated that topics extracted from project descriptions significantly affect performance [9].
Chang et al. (2020) explored the role of product post quality in Facebook’s second-hand marketplace. They found that more complete and accurate posts significantly influenced buyer perceptions and increased purchase likelihood. Their results suggest that well-constructed soft signals, such as detailed descriptions, can enhance trust and drive sales in second-hand e-commerce [19]. However, their study did not analyze the text of posts.
With the rapid increase in data size, marketing researchers have turned to machine learning techniques to process large amounts of unstructured data, such as textual data from product descriptions and reviews. Topic modeling, an unsupervised machine learning approach, is a method that has been explicitly developed for analyzing textual data. This technique was first proposed by Blei et al. (2003) and involves clustering large amounts of text into topics based on word usage patterns [13]. They later introduced the LDA model, assuming that a topic is a distribution of
words within a document and that each document comprises a distribution of topics [27]. However, topic modeling has limitations, particularly when selecting the number of topics that have traditionally been performed manually [9, 28, 29]. This manual selection often affects the model’s validity and leads to unsatisfactory results [30]. Koltcov (2018) argued that by drawing analogies to physical systems, entropybased techniques, such as Renyi entropy, could be applied to improve topic model optimization [31]. Renyi entropy helps automate the topic selection process by identifying the point at which the system holds the most useful information. In a system modeled after physical phenomena, entropy is minimized when the number of topics is optimally set, similar to how a physical system seeks equilibrium in a minimal energy state [32].
Renyi entropy has been utilized in various studies to extract insights from different data types. For instance, Sun et al. (2021) applied Renyi entropy to the retail sector to analyze point-of-sale (POS) data, combining it with topic models to identify patterns in consumer behavior and strategically assist in product selection and promotion [33]. This study showed that Renyi entropy is a valuable tool for extracting insights from diverse datasets, including e-commerce transactions, where structured signals and textual descriptions are abundant.
By incorporating Renyi entropy into topic modeling, we significantly improve the validity and efficiency of sentiment analysis by determining the optimal number of topics. This study also leveraged Koltcov’s methodology to filter and select the ideal number of topics, ensuring that the topics provided the most meaningful information within our dataset.
2.3 Topic modeling and sentiment analysis
Section titled “2.3 Topic modeling and sentiment analysis”Sentiment is a subjective element that can shape how people perceive and evaluate information [34, 35]. Over the years, text data have been extensively utilized to extract emotions such as praise, criticism, or neutrality, which inform consumer decision-making [36]. Qian et al. examined competitive attribution models to understand how products compete based on emotional attributes expressed through customer reviews [37].
Sentiment analysis of textual data, especially in reviews and product descriptions, has gained significant popularity [35, 36, 38]. However, most studies focus on product reviews written by customers, with relatively few investigating the sentiments conveyed by sellers in product descriptions. Traditional sentiment analysis methods often rely on word-frequency-based techniques in which a predefined sentiment dictionary assigns a score to the text [35]. While useful, this approach is limited to fully capturing contextual or nuanced emotional cues within descriptions. Thus, some studies have focused on calculating positive and negative sentiments separately to analyze their distinct effects [9]. Others have observed that customer perceptions of emotions can vary depending on the product quality and the type of product being reviewed [25].
To address the limitations of conventional methods, we incorporate Renyi entropy into sentiment analysis and topic modeling. This approach allows for greater accuracy by considering both the word frequency and the contextual meanings of those words. The results provide a more precise understanding of how sentiment is conveyed in product descriptions, thus enhancing the reliability of our findings.
In summary, applying Renyi entropy in topic modeling and sentiment analysis enables optimal topic selection and produces more precise sentiment scores. By tracking shifts in sentiment across different topics, we can better understand how different topic clusters influence sentiment, which is crucial in today’s data-driven marketing environment [37, 39, 40].
3 Research framework and hypotheses
Section titled “3 Research framework and hypotheses”3.1 Research framework
Section titled “3.1 Research framework”This study advances the existing research by introducing SATORE, a novel approach to sentiment score measurement, providing a new perspective on the impact of product descriptions and context-sensitive emotional content on customers’ purchase intentions. Whereas prior studies, such as Sun et al. (2024), utilized traditional sentiment analysis methods, this research employs a more sophisticated technique to capture emotional subtleties in product descriptions [11]. This method allows for a more detailed analysis of customer responses, particularly in the context of high-value products, an area that has been underexplored in previous studies. By applying this model to a large dataset from Mercari, Japan’s largest e-commerce platform, we offer fresh insight into the influence of emotionally rich product descriptions.
This study investigated the impact of product descriptions and sentiment elements extracted through SATORE on customer purchase intentions. We analyzed product description texts from Mercari, one of Japan’s largest online marketplaces to achieve this. Figure 1 shows the possible signals exchanged between sellers and buyers on Mercari, as adapted from previous research [10].
Sellers begin by listing products on the platform, including key details such as price, condition, photos, and descriptions. Customers provide feedback through likes and comments that serve as signals to potential buyers. These
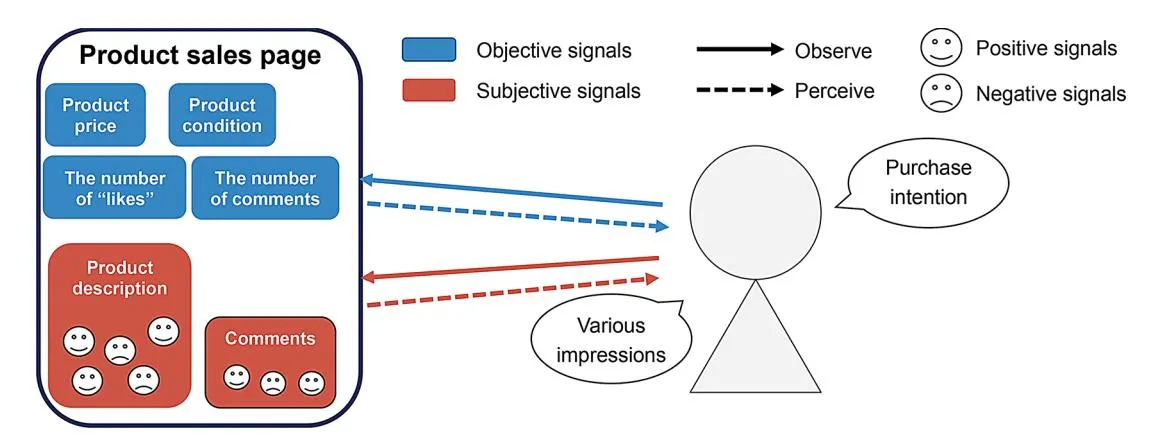
Fig. 1 Signal exchanges between sellers and buyers, adapted from Sun [10]
signals can influence purchasing decisions by conveying information about a product’s popularity and quality.
In this context, product price, condition, number of likes, and comments represent hard information (signals) as they are quantifiable. By contrast, product descriptions and customer comments comprise soft information (signals) because of their textual and subjective nature. Signals have different effects on various objects. These signals with soft information contain the hidden sentiments of the sellers and buyers. Product photos may contain both hard and soft information because they can contain both digital information and the possibility of displaying textual information that needs context to be understood through the photo.
This study examined how product descriptions, particularly context-sensitive emotional content, influence purchase intentions on C2C platforms. While ELM offers a useful framework for understanding how persuasive communication is processed, we focus on the direct, measurable impacts on consumer behavior, specifically purchase decisions [12]. This distinction is crucial because our research aims to measure the direct impact of specific signals on consumer behavior in an e-commerce setting where decisions are often made rapidly and based on immediately available information.
Buyers rely on signals sent by sellers to make purchasing decisions. This study seeks to uncover how the signals embedded in product descriptions influence buyer purchase intentions, an area that has received limited attention in prior research. To accomplish this, we demonstrate product descriptions’ impact on customers by answering the following questions: (1) Does the description sellers put on the product sales page affect buyers’ purchase intent? (2) If so, how does this description influence buyers’ purchase intentions? To achieve these objectives, SATORE was employed to extract sentiment features from product descriptions, and logistic regression models were used to assess the impact of these features on purchase decisions and reveal the relationship between product descriptions, sentiment elements, and purchase intentions. The results of this study can provide valuable insights for online sellers and marketers to optimize product descriptions and improve customer satisfaction.
3.2 Hypotheses
Section titled “3.2 Hypotheses”3.2.1 The impact of hard information on customers’ purchase intention
Section titled “3.2.1 The impact of hard information on customers’ purchase intention”This study considers hard information on Mercari, such as the number of comments, likes, and product prices. As discussed in Chap. 2, likes and comments are frequently viewed as indicators of a product’s popularity [3, 6, 7]. These hard signals, provided by potential buyers, reduce information asymmetry by offering additional insights that the seller does not provide directly.
In line with Signaling theory, price is a critical signal in C2C e-commerce platforms because it represents both product value and perceived risk to the buyer, a factor highlighted in prior research [6, 41]. This factor aligns with more recent studies, such as Chen et al. (2023), which emphasize the role of signaling theory in social commerce and how risk perceptions drive the need for stronger signals to mitigate uncertainty [42]. As product prices increase, buyers perceive higher risk, demanding greater reliance on hard signals such as likes and comments to reduce uncertainty in purchasing decisions [3, 7].
Our focus on high-priced items stems from prior research showing that interactions among different signals can vary based on product characteristics. For instance, Kim (2021) found that online reviews significantly increased the downloads of lower-ranked products but had little impact on topranked items [25]. Studies suggest that the signal impact may differ depending on product price, a critical factor influencing perceived risk. High-value items tend to carry greater perceived risk, and buyers seek more social proof, such as likes and comments, to reduce uncertainty in such transactions.
Given that the effects of one signal can vary with others, we hypothesize that product price influences how signals, such as likes and comments, affect customer decisions [25]. We argue that the product’s price changes the customer’s perception of hard and soft information in the product description because high-value transactions often involve greater emotional investment and perceived risk, making social proof from likes and comments more influential. Therefore, this study proposes the following hypotheses:
H1a The number of likes from potential customers on products on C2C e-commerce platforms such as Mercari positively influences buyers’ purchase intentions, with a stronger effect for higher-priced items.
H1b The number of comments from potential customers on products positively influences buyers’ purchase intentions, with a stronger effect for higher-priced items.
3.2.2 The impact of the product description on customers’ purchase intention
Section titled “3.2.2 The impact of the product description on customers’ purchase intention”Although many previous studies have explored the usefulness of hard information signals, such as product comments and ratings, and their impact on buyers’ purchase intentions, few studies have examined the influence of soft signals, such as product descriptions, on purchasing behavior [3, 6, 7, 9, 43].
In C2C e-commerce, product descriptions provide information and act as trust signals. Mavlanova and Benbunan-Fich (2010) suggested that if a product description is of low quality, buyers may perceive it as a signal of the seller’s dishonesty, even if the seller provides other evidence of credibility [44]. Therefore, we argue that the quality of product descriptions is crucial for buyers’ purchasing decisions and that quality can be complemented by emotional engagement.
The Matching Hypothesis [45, 46] suggests that emotional appeals are particularly effective in changing affectbased attitudes. By contrast, cognitive appeals grounded in logic and facts are more effective in changing cognition-based attitudes. This theory has been instrumental in persuasion research, emphasizing the role of emotional engagement in shaping consumer attitudes and behaviors [47, 48].
As Pham and Muthukrishnan (2002) highlight, emotional responses often lead to more persistent attitude changes, making them crucial in high-stakes purchasing contexts where buyer uncertainty is high [49]. Ahmad and Laroche further demonstrated that emotionally expressive content positively affects consumer perceptions of review helpfulness, which can translate into stronger purchase intentions [50]. Our study expands on these insights by integrating emotional appeals with product recognition, arguing that emotionally rich product descriptions do not replace informational quality but act as a supplementary mechanism to reduce perceived risks and enhance trust, especially in highvalue transactions. High-value products often involve more emotional investment from buyers, making descriptions emphasizing emotional engagement crucial for shaping purchase intentions. Consequently, soft signals, particularly emotionally rich product descriptions, work interactively with quality information to guide buyer behavior in highvalue segments, where buyers face more uncertainty and thus place more weight on emotional cues [51, 52]. Therefore, we propose the following hypothesis:
H2 Emotionally rich product descriptions on C2C platforms have a stronger impact on purchase intentions for high-value products than for lower-value products.
Various aspects can be used to measure the effectiveness of the information in product descriptions. For instance, previous studies suggest that the criteria for measuring information quality include completeness and accuracy [19, 53, 54]. Additionally, many studies have analyzed sentiments in comments from other potential buyers and how these sentiments influence product perceptions and purchase decisions [9, 35].
However, most sentiment analysis studies have focused on product reviews or customer feedback, with relatively few examining the impact of sentiment expressed by sellers in product descriptions on buyers’ purchasing decisions, which is the primary focus of this study (as discussed in Sect. 3.1). Our study not only explores the role of sentiment in product descriptions but also introduces SATORE based on context. This method allows for a more nuanced understanding of how these sentiments, both positive and negative, and informational content from products influence purchasing behavior, especially in high-value transactions where consumer uncertainty is higher. This study provides a new perspective emphasizing the direct impact of soft information on purchase decisions that focus on the emotional richness of product descriptions. In particular, we examine how emotionally rich product descriptions play a crucial role in high-value market contexts, in which buyers are more likely to be influenced by trust and emotional engagement. Our method, SATORE, represents a significant innovation in the study of e-commerce and consumer behavior, offering a more sophisticated method for capturing the complexity of emotional influence in purchase decisions.
Moreover, some studies show that comments often reveal emotions such as happiness, anger, criticism, and praise, which customers use to make purchasing decisions [35,
38]. Regarding product descriptions, the role of emotions in describing a product must be considered. Previous studies have suggested that emotionally positive descriptions appeal more to customers [35, 55]. However, some sellers deliberately write negative information in their product descriptions to attract attention and prevent specific disputes. By contrast, others warn that buyers who do not read product descriptions carefully should not buy the item, which can be recognized as a trust-building signal [10].
Several studies have shown that positive emotions in product information affect buyers’ purchase decisions [9, 19]. We hypothesize that positive sentiments in product descriptions may also positively influence buyers. Hence, we propose the following hypothesis:
H3 Positive sentiment elements in product descriptions on C2C platforms, such as Mercari, positively influence buyers’ purchase intentions, and this effect becomes stronger as product prices increase.
4 Data and methodology
Section titled “4 Data and methodology”4.1 Data collection
Section titled “4.1 Data collection”Data for this study were collected from Mercari, Japan’s largest online marketplace. This research focuses on figuretype products, as many are limited-edition products and can command premium prices. For instance, a limited-edition figure with an original price of ¥100,000 may sell between ¥300,000 and ¥500,000 on the platform. In high-value transactions such as these, buyers and sellers invest more effort in structuring trust-based relationships. Sellers may focus on providing comprehensive and detailed product descriptions, timely communication, and a reliable reputation. This effort should not only involve adding positive sentiment content such as “This is great!” but should include descriptive details such as product history, condition, and specific features that align with buyers’ emotional and cognitive expectations. This combination of emotional appeal and factual information is crucial for reducing perceived risks in high-value transactions. Simultaneously, buyers
often review seller feedback, read product descriptions, and compare options to mitigate risks associated with highvalue purchases. By evaluating emotional tone and detailed content in product descriptions, buyers can form a more balanced perception of the seller’s credibility, which is especially critical when the stakes are high.
The dataset includes over 4.4 million transactions recorded over one year, spanning product sales from January to December within the past five years. Each record contained information on product descriptions, prices, number of reviews, likes, and product conditions.
4.2 Methodology
Section titled “4.2 Methodology”The SATORE framework used in this study to test the hypotheses presented in Chap. 3 comprises four steps. First, in Step 1, we implement the LDA model to identify the underlying information from the project description [13]. Then, we use Renyi entropy to choose the proper number of topics. Next, we calculate sentiment scores by combining the topic model results with a Japanese sentiment dictionary, thus introducing the topic model approach into the sentiment score calculation [56]. This differs from most prior studies that calculate scores directly from word frequencies. Finally, we use this sentiment score as a variable and employ a logistic regression model to determine whether our theory can be validated along with other variables.
4.2.1 Step 1: Topic information from the product description
Section titled “4.2.1 Step 1: Topic information from the product description”The LDA model is implemented in this step to derive topic information from the product description. The LDA model has long been one of the most crucial topic models for analyzing text data. Table 1 lists the symbols used in the LDA model [27].
To perform the LDA model, we first conduct morphological analysis using mecab and segment each product description d into a ‘bag-of-words’ from collections of all product descriptions [57]. Unlike previous studies, this study chose all types of words to calculate sentiment scores. Then, a dictionary is created by combining these ‘bag-of-words’ and the
Table 1 Descriptions for symbols in the topic model
| Symbols | Description for text document collection | |
|---|---|---|
| T | The number of topics | |
| D | Collections of text document, or in this research, product description | |
| N | The number of words in a product description collection | |
| Wd, n | The nth word in the product description d | |
| Zd, n | The set of expected topics for the nth word in the product description d | |
| θt, d | The distribution of topics (t’s) for the dth product description | |
| Φw, t | The distribution words (w’s) for the topic t | |
| α | Per- product description topic distribution | |
| η | Per-topic word distribution |
Japanese sentiment dictionary. This dictionary is then used to generate topics and assign them to each product description by calculating two distributions, one for the topic distribution. in each product description d, and the other for the distribution of words with a high probability for each topic t. This calculation is expressed as follows:
(1)
where t denotes the topic. is a parameter determines the per-document topic distribution, which contains the distribution of words by topic. This distribution has two settings: symmetric and asymmetric. Symmetric means that each topic has the same distribution throughout the product description, as adopted by most prior research and this research.
4.2.2 Step 2: Renyi entropy for selecting the number of topics
Section titled “4.2.2 Step 2: Renyi entropy for selecting the number of topics”Choosing an appropriate number of topics in studies using topic models is challenging. Traditional approaches, such as perplexity, often do not account for the complex hierarchical nature of textual data. Jiang et al. (2020) used their experience to select four highly relevant topics from the results of implementing the topic model on crowdfunding project descriptions [9]. Our research adopts a novel approach utilizing Renyi entropy to determine the optimal number of topics in hierarchical topic models [31]. Renyi entropy serves as a metric for evaluating the quality of hierarchical models, treating a collection of texts as a statistical system characterized by entropy. Unlike traditional methods, Renyi entropy accounts for the dynamic nature of textual information, which contrasts with the static nature of physical systems. In a textual system, entropy can be altered through data ordering processes, such as topic modeling, aiming for a state of minimum entropy that signifies maximum information [31, 32]. Moreover, Renyi entropy explicitly includes the ‘number of topics’ as a deformation parameter (q = 1/T), integrating it into the entropy calculation. This integration is critical because it allows the model to adjust the number of topics dynamically, ensuring a more accurate and informative representation of the underlying data structure [31, 32].
This approach is particularly beneficial for analyzing complex, multilevel textual data, where traditional methods such as perplexity may fall short. By using Renyi entropy, we can more effectively capture the nuances of hierarchical data structures, making it a more suitable choice for our study.
The Renyi entropy measures the system’s entropy using the partition function’s values and the state density function . This calculation can be expressed as follows:
(2)
where q=1/T represents the deformation parameter and T is the number of topics. The number of topics controls the value of Renyi entropy. This formula is derived through the following steps.
First, the state density function is calculated as the ratio of high-probability words N to the product of the number of unique words in the product description collection W and number of topics T. The equation used is as follows:
\rho = N/\left(WT\right) \tag{3}
Next, the free energy of the topic model in the system, E, was calculated as the natural logarithm of the normalized sum of the word probabilities . This calculation can be described as follows:
(4)
where is the distribution of word w under topic t. represents words with high probabilities, and if zero otherwise.
In step 3, the partition function , representing the total information of the statistical system, is computed as an exponential function of the energy E and entropy S. The general formula expresses the relationship between these terms through an exponential function, capturing the balance between the system’s energy and disorder (entropy).
Z_q = e^{-qE+S} = \rho(\tilde{P})^q \tag{5}
where the exponential term captures the influence of free energy and entropy on the system’s state. The term represents the state density function that sums the probabilities of each word’s occurrence for a given topic. The equality of these two terms highlights how the partition function can be expressed directly in terms of state density, effectively summarizing the system’s behavior based on word distributions (probabilities) within topics. Using , the Renyi entropy can be calculated using Eq. 2. All mathematical notations are summarized in Table 2.
Table 2 Description of symbols in Renyi entropy
| Symbols | Description for product description collection | |
|---|---|---|
| ρ | State density function | |
| N | Number of high-probability words | |
| W | Number of unique words in the product description collection | |
| T | Number of topics | |
| E | Energy | |
| ∼ P | Normalized sum of word probabilities | |
| φ wt | Distribution of word w under topic t | |
| 1{φwt>1/W} | > 1/W Indicator function, equals 1 if φ wt , otherwise 0 | |
| Zq | Partition function | |
| q | Deformation parameter, q = 1/T | |
| S | Entropy | |
| SR q | Renyi entropy |
Along with the Renyi entropy, the renormalization technique was used in this study to accelerate the computation, achieve a fast approximation of Renyi entropy, and search for the optimal number of topics [32]. In our approach, Renyi entropy is minimized to identify the state of maximum information, similar to finding an equilibrium state in a physical system. This minimization process allowed us to automatically determine the optimal number of topics, thus enabling us to distinguish subtle shifts between emotional expressions and cognitive content in the product descriptions. By achieving this balance, our method ensures that emotional- and recognition-based content is accurately represented, resulting in refined sentiment scoring that aligns more closely with consumer behavior in high-value market contexts.
4.2.3 Step 3: The calculation of sentiment scores
Section titled “4.2.3 Step 3: The calculation of sentiment scores”Similar to reviews, product descriptions written by sellers on C2C platforms express positive or negative attitudes. This study used the results of a Japanese sentiment dictionary [56] developed by psychologists to assign sentiment scores to words found in product descriptions, allowing us to reflect the practical emotions expressed. Unlike previous studies, which mainly used simple keyword-based methods or pre-labeled datasets, our approach combined LDA with Renyi entropy. These methods uncover hidden topic structures in the text, allowing for more nuanced sentiment scoring beyond the basic keyword-counting methods [9, 26, 35]. For instance, keyword-based approaches typically involve counting the occurrences of positive and negative words in a text, which can be simplistic and may not capture nuanced sentiments expressed in complex sentences [18]. Dictionary-based methods, such as those using AFINN or LIWC dictionaries, assign predefined sentiment scores to words. However, similar to keyword-based approaches, they often fail to account for context or sentiment conveyed by multiword expressions [58].
Our SATORE approach leverages LDA combined with Renyi entropy to uncover topic structures within the text and assigns sentiment scores based on word distributions within each topic [13]. This approach captures sentiments more accurately and reduces reliance on pre-labeled datasets. By combining unsupervised learning and statistical physics, our method offers a robust and scalable solution for analyzing sentiments in high-value product descriptions [32]. Figure 2 outlines the step-by-step process for calculating the sentiment scores.
First, we apply the topic model to decompose product descriptions into topics and assign words to each topic. We hypothesize that a single product description can encompass
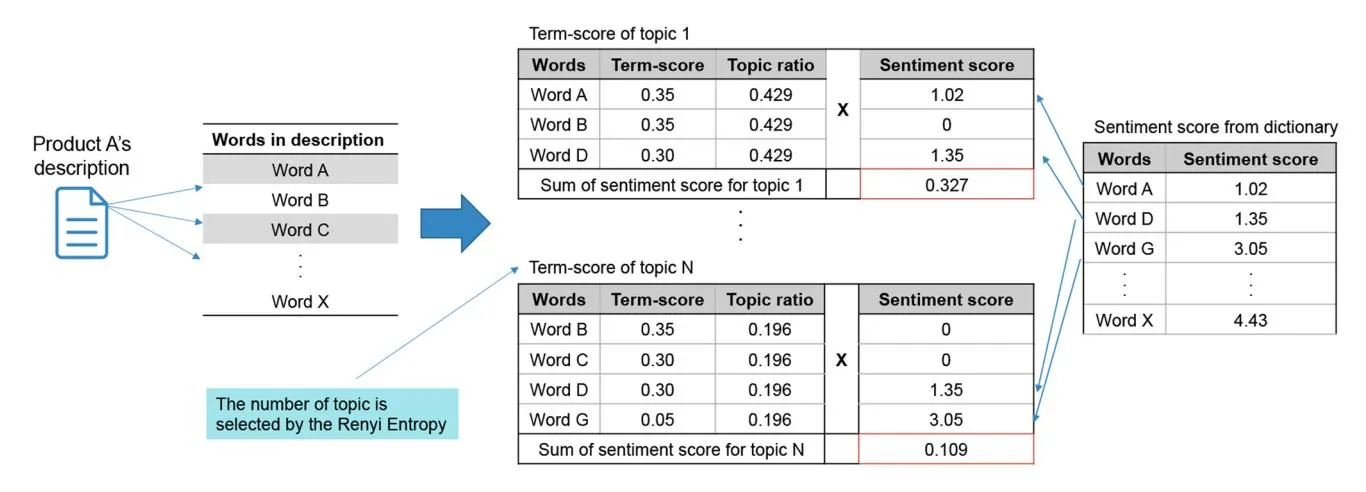
Fig. 2 The procedure for calculating sentiment scores
multiple topics, each carrying its own sentiments. This implies that sentiment is inherently linked to topics within a product description, reflecting the diverse aspects and qualities of the product being described. Using a Japanese sentiment dictionary, we assigned sentiment scores ranging from 1 to 5 depending on the negativity or positivity of each word within the topics [56]. Words that were not listed in the dictionary received a score of 0. Although this approach may exclude certain words that could potentially carry sentiment, assigning a score of 0 ensures that only words with a clear, defined sentiment contribute to the overall score, which reduces the risk of introducing errors or noise from words whose sentiment is uncertain or ambiguous. This avoids the potential distortion arising from an arbitrary attempt to infer the sentiments of unknown words. Although this method may introduce a slight bias by overlooking certain words, we believe this is a necessary trade-off to maintain the accuracy and clarity of the sentiment scoring process. In future work, we will explore alternatives such as using average sentiment scores or implementing context-aware embedding models (e.g., BERT) to account for unclassified words more effectively. The diversity of topics in a product description represents the diversity of sentiment expressions, which is crucial for comprehensively capturing sentiment profiles. Renyi entropy plays a key role in this process by helping to select the optimal number of topics, ensuring that the diversity of topics is balanced with the need to reflect variations in sentiment accurately. By minimizing the Renyi entropy, we avoid excessive fluctuations in sentiment while capturing the necessary changes that reflect the various attributes of the product. This balance is particularly valuable for marketing, as it reveals the range of emotions conveyed in the descriptions and the potential appeal and complexity of the product’s presentation.
Finally, we sum the sentiment scores calculated for all topics. This process is expressed as follows:
Sentiment Score of P roduct d
(6)
where d represents the dth item in the total, Scorew is the sentiment score for the wth word in product d which is obtained by referring to the results in the Japanese Sentiment Dictionary. p (w|t) and p (t| d) have the same meaning as in the formula of the topic model, the distribution of words by topic, and the distribution of a product description collection by topic.
Figure 2 presents the distribution of the term score, topic ratios, and sentiment scores. Term score represents the distribution of words within each topic in the topic model. Each term’s score indicates the probability of a word appearing on a given topic. The sum of the term scores for each topic is 1. The topic ratio indicates the distribution of topics within a text. Each topic ratio indicates the proportion of the text associated with a specific topic. The sum of the topic ratios for each text is 1. The sentiment score was derived from a dictionary, as explained earlier.
We adopt this approach because calculating sentiment scores directly from word frequency, as explained earlier, can lead to overly simple results. Sentiment scores based purely on the number of positive words do not account for the contextual meaning of those words, potentially leading to inflated or misleading sentiment measurements that would contradict the managerial implications that our study seeks to provide, emphasizing the importance of authentic emotional engagement rather than superficial positive wording.
By applying SATORE, we ensure that sentiment scores are determined by the quantity of positive or negative words and the context in which these words are used. Topic modeling allows us to extract underlying themes from product descriptions, thus providing a richer understanding of the sentiments conveyed. This approach captures both the topic structure and the emotional depth of descriptions, resulting in more accurate and context-sensitive sentiment scores.
This method aligns with real-world consumer behavior, in which buyers respond to individual positive words and the product description’s overall coherence and emotional tone. Therefore, sellers should use our findings to express emotions more effectively and authentically through product descriptions. Instead of merely adding positive words, sellers should focus on crafting descriptions that create genuine emotional resonance with potential buyers, which is more likely to influence purchase decisions meaningfully. This approach is more effective from a business standpoint as it builds trust and emotional engagement rather than relying on superficial sentiment manipulation.
4.2.4 Step 4: Verification of hypotheses by logistic regression model
Section titled “4.2.4 Step 4: Verification of hypotheses by logistic regression model”In this last step, we verify several hypotheses proposed in Chap. 3 using the sentiment scores obtained in Steps 1 to 3 as variables in the logistic regression model, as expressed in Eq. 7.
(7)
In this model, other signals with hard information, such as the number of likes, product price, and number of reviews,
Table 3 Variables’ definition
| Type | Variable | Definition |
|---|---|---|
| Dependent Variable | Sold | A dummy variable (1 if the product d is in the status of ”sold”, and 0 if the product d is in the status of “cancel.”) |
| P (Sold=1 x) | The likelihood that it Sold is 1, given the observed value of x. | |
| Independent Variable | Countlike | The total number of “likes” that potential buyers clicked |
| Countcomment | The total number of comments that potential buyers made | |
| Priceproduct | Product price | |
| Sentiment Score | The sentiment score extracted from the product description |
have also been used. Table 3 presents definitions of the variables used in the model.
In this analysis, the dependent variable, Sold, represents a binary outcome coded as 1 if a product sale is completed and 0 if the sale is canceled. We exclude active listings, which introduce uncertainty regarding the influence of product descriptions on sales because their outcomes remain undetermined. We employ sentiment scores as an independent variable, accurately extracted from product descriptions via SATORE, designed to capture the subtleties of emotional expression, which is contrasted with hard data signals, such as the total number of likes and comments from potential buyers and the product’s listed price, to detect their joint influence on the likelihood of a product being sold. Recognizing the potential for model overfitting, we validated our results using a robust 5-fold cross-validation technique. This method enhances the reliability of our findings by ensuring that they generalize well to unseen data.
Importantly, we divide our dataset into price segments using these segments as control variables to identify the different impacts of sentiment across various price points. This stratification is not random; it is a deliberate methodological choice that reflects our hypotheses regarding the nuanced role of price in consumer decision-making. In high-value transactions, where buyer hesitation is presumably greater, we anticipate that the emotional resonance of product descriptions will be more influential, a premise we have now tested through a logistic regression model applied separately within each price band. This granular approach to data segmentation by price underscores the hypothesis that price is a critical control variable, particularly in the premium segment, where product narratives imbued with positive emotions may influence buyers significantly. By employing this method, we gain a more sophisticated understanding of the variables at play, allowing for a nuanced interpretation of how sentiment scores can influence purchase intentions, particularly as product values increase.
Table 4 Descriptive statistics of dependent variables
| Variables | Min | Median | Mean | Max | Std |
|---|---|---|---|---|---|
| Price | 300 | 2,280 | 21,142 | 9,999,999 | 38,0671.44 |
| Num of likes | 0 | 1 | 2.30 | 357 | 3.29 |
| Num of comments | 0 | 0 | 1.16 | 479 | 2.61 |
| Sentiment score | 0 | 0.06 | 0.09 | 0.68 | 0.09 |
| Sold | 0 | 1 | 0.61 | 1 | 0.49 |
Table 5 Correlation between the dependent variables
| Senti | Price | Num of | Num | |
|---|---|---|---|---|
| ment | comments | of | ||
| score | likes | |||
| Sentiment score | 1.00 | |||
| Price | -0.01 | 1.00 | ||
| Num of comments | 0.01 | 0.02 | 1.00 | |
| Num of likes | 0.01 | -0.00 | 0.17 | 1.00 |
5 Empirical result
Section titled “5 Empirical result”5.1 Descriptive statistics
Section titled “5.1 Descriptive statistics”Table 4 presents descriptive statistics for the independent and dependent variables. A median price of ¥2,280 suggests that half of the products are priced relatively low, whereas a mean price of ¥21,142 reflects the inclusion of high-priced items within this category. The median number of likes is 1, with a mean of 2.3, whereas the median number of comments is 0, with a mean of 1.16. These statistics suggest that at least half of buyers do not actively engage with sellers. More than 50% of the product descriptions in the sample exhibited sentiment, as indicated by a median sentiment score greater than zero, indicating that most descriptions contained at least some emotional content, with higher sentiment scores reflecting more positive emotions expressed in the descriptions. Positive sentiments in over half of the descriptions suggest that sellers often aim to engage buyers emotionally through product descriptions, potentially increasing buyers’ trust and purchase intent. This finding reinforces the significance of sentiment as a soft signal that influences purchase decisions, especially in high-value transactions, where emotional resonance plays a critical role.
Table 5 presents the correlations among the variables used in the model. The slight correlations observed among the variables are not sufficiently strong to affect the model
results. Table 6 shows the results of the variance inflation factor (VIF) analysis. All VIF values are below 1.1, indicating that multicollinearity is not a concern for the model.
5.2 Hypothesis testing based on the whole data
Section titled “5.2 Hypothesis testing based on the whole data”5.2.1 General results
Section titled “5.2.1 General results”This section presents the results of data processing. We employed SATORE for the entire dataset and selected the optimal number of topics, resulting in twenty-four. Table 7 presents the topic model results, which have also been demonstrated in previous studies [10]. These topics can be broadly classified into five categories: One category is the description of the product characters, containing seven topics: Dragon Ball, Demon Slayer, One Piece, Kamen Rider, Ultraman, Pokemon, and Gundam. The other category has six topics that summarize the description of the product’s status: product size, defects in the product, unopened
tos. Four topics are about delivery methods, including the “rakuraku” delivery service specially provided by Mercari, descriptions of other delivery methods, descriptions of how the products are packaged for delivery, and descriptions of
Table 6 VIF results for each variable
delivery costs. Finally, there were three categories of topics, including Japanese honorifics. Additionally, there is a category of topics dedicated to representing some negative information that will appear in the product descriptions: one describing the refusal to sell
the product under certain specific circumstances and one representing the refusal to negotiate the price. Finally, the product, opened product, limited product, and product pho-Dependent variables VIF Sentiment score 1.00 Price 1.00 Num of comments 1.08 Num of likes 1.03
Table 7 Topic models’ results, adapted from sun [10]
| Topic’s category | Topic’s name | Representative words |
|---|---|---|
| Description of | Dragon Ball | dragon, ball, super. Sun, Goku, saiya, figure, Vegeta |
| the product’s characters | Demon Slayer (kimetsu no yaiba) | Demon, Slayer, Tanjiro, Kamado, figure, Nezuko |
| One piece | one, piece, figure, Luffy | |
| Kamen Rider | Kamen, Rider, belt, zero, transformation, move ment, driver | |
| Ultraman | Ultra, man, monster, series, medals, set | |
| Pokemon | doll, paint, Pokemon, dedicated, figure | |
| Gundam | product, parts, Gundam, appearance, mm (milometers) | |
| Description of | Product size | cm (centimeter), size, height, figure, made in |
| the product’s | Defects in products | Scratches, box, item, not |
| status | Unopened product | unopened, new product, box, prize, figure |
| Opened product | box, storage, display, opened, condition | |
| Limited product | figure, limited, edition, unopened, theater, privi lege, new | |
| Product photo | Picture, image, all | |
| Delivery methods | ”Rakuraku” delivery service | Mercari, mail, send, rakuraku, delivery |
| Descriptions of other delivery methods | Non-standard-size mail, petit shipping, sample, miniature | |
| Descriptions of how the products are packaged for delivery | small, send, packaging, box, container, bag | |
| Descriptions of delivery costs | yen, exhibit, other, set, postage, purchase | |
| Japanese-spe cific honorific words | Honorific language 1 | please, would like, understanding, thank you |
| Honorific language 2 | please, purchase, in case of, product | |
| Honorific language 3 | please, honorific pluralizing suffix, like | |
| Negative information | Refusal to sell the product under certain circumstances | manner of, please refrain from, quality, nervous ness, concern, please do not, purchase |
| refusal to negotiate the price | purchase, immediately, ok, price drop, not avail able, unopened | |
| Others | Ichibann-kuji | Lottery, first, prize, unopened, figure, last |
| Capsule toy | Capsule, toy, all, set, mini, product | |
| last category contains the products’ origin; one is “ichibannkuji,” a Japanese character figure lottery, and the other represents the capsule toy. Based on these topic results, the sentiment score of each product description was calculated and used in the logistic regression model, as shown in Eq. 7. |
The data presented in Table 8 are the results of the logistic regression model for all data, which reveals that the p-value for each variable is below 0.001, indicating that each variable has a significant causal relationship with the success of product sales. The 5-fold cross-validation results in a model accuracy of 58% and a ROC-AUC of 66%. Although the model’s accuracy is not dramatically higher than the 50% baseline, it still represents a meaningful improvement, indicating that the model captures underlying patterns in the data that a random baseline would not. The ROC-AUC score of 66% is particularly noteworthy, as it demonstrates the model’s ability to distinguish between positive and negative outcomes across varying thresholds, which is especially important in cases where class distributions are imbalanced. Although the current performance highlights areas for further improvement, it also provides a strong foundation for model refinement. Future work could optimize the feature selection, fine-tune the model parameters, or explore more advanced modeling techniques to improve accuracy and discrimination power.
The coefficient of likes at -0.01 indicates a minimal impact, whereas the number of comments has the highest coefficient at 0.33, signifying its strong influence on transactions. The constant variable has a coefficient of 0.29, indicating a baseline purchasing tendency. Notably, the sentiment score exhibits a significant coefficient of -0.19, implying that positive sentiment in product descriptions may reduce purchase intentions unexpectedly.
This result deserves further exploration to understand its underlying causes fully. Notably, for every 1-unit increase in the sentiment score, a corresponding decrease in purchase intention implies that customers may perceive an overly positive sentiment in product descriptions as less credible. While the sentiment score quantifies the degree of positivity or negativity in the descriptions, an increase in the coefficient suggests that potential buyers perceive higher sentiment scores, indicating positive emotions.
Table 8 Logistic regression model’s result for all data
| Independent variables | Coefficient | Stand error | |
|---|---|---|---|
| Const | 0.29*** | 0.02 | |
| Sentiment score | -0.19*** | 0.012 | |
| Price | -0.00002032*** | 0.000 | |
| Num of comments | 0.33*** | 0.001 | |
| Num of likes | -0.01*** | 0.000 | |
| Accuracy | 0.58 | ||
| ROC AUC | 0.66 |
Note *** p-value<0.01
It is important to highlight that the sentiment score reflects a continuum of sentiments, from negative to positive, and not merely a binary distinction, suggesting that buyers may trust moderate expressions of sentiment more than extreme positivity. Future research could further refine the sentiment score variable or explore nonlinear relationships between sentiment and purchase intention, as customer responses to sentiment may differ at varying levels of positivity or negativity.
By contrast, the relatively low coefficients for price and the number of likes suggest that these factors have a limited impact on customers’ choice of products. Finally, the p-values for all parameters are lower than 0.01, enhancing the trustworthiness of these results.
The choice of accuracy and ROC-AUC over pseudo-R-squared for model performance assessment is based on their direct relevance in classification contexts. Accuracy provides a straightforward measure of the model’s capability to predict correctly, whereas ROC-AUC offers an aggregate performance measure across various threshold settings, which is crucial for imbalanced datasets. Pseudo R-squared, while useful, does not capture the model’s predictive power as effectively in classification scenarios, such as accuracy and ROC-AUC.
5.2.2 Hypothesis testing based on data partitioning
Section titled “5.2.2 Hypothesis testing based on data partitioning”As elaborated in Sect. 4.2.4, this study utilized figures, a product category often commanding prices above their initial value, to test our hypotheses. Data segmentation and analysis using a logistic regression model across multiple price ranges were meticulously performed. This approach, involving continuing data exclusion below established price points, was carefully chosen to maintain an ample sample size and to rigorously examine the proposed hypotheses concerning the variable impact of hard and soft information signals, particularly within transactions of higher-value goods.
Figure 3 shows the distribution of the samples across different price ranges. The horizontal axis of the chart represents the price range, and the vertical axis represents the ratio of the samples. The figure shows that the number of products sold decreases as the price increases, suggesting that customers are more inclined to purchase lower-priced items. Figure 4 shows the success rates of the products sold in different price ranges. The success rate decreases as the price increases. For example, the success rate for products priced above ¥14,000 was less than 50%, whereas that for products priced above ¥100,000 was less than 10%. This result indicates that customers hesitate to purchase figures as the prices increase.
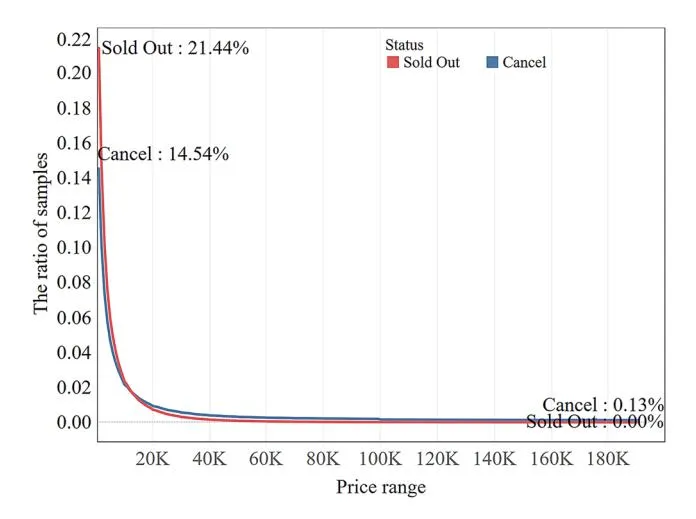
Fig. 3 The ratio of samples over different price ranges
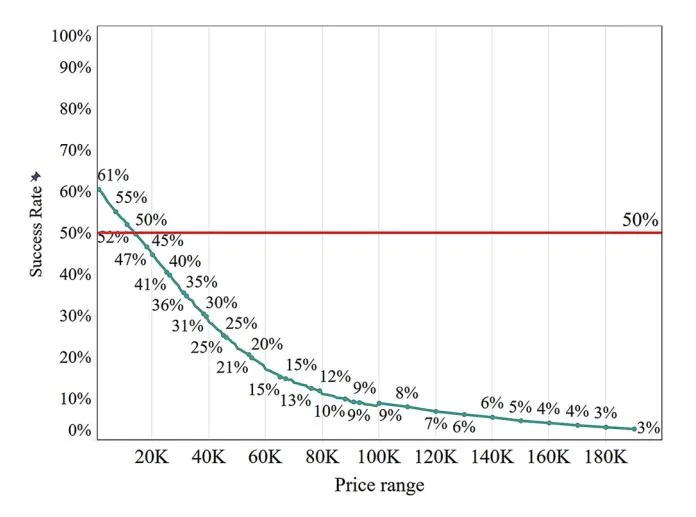
Fig. 4 Success rate of products sold in different price ranges
Figure 5 delineates the model’s accuracy and ROC-AUC across diverse price segments. Although the model’s accuracy remains relatively stable across different price ranges, the ROC-AUC score increases, suggesting that the model’s ability to distinguish between successful and unsuccessful sales improves as the product’s price range increases.
The coefficients for each variable are shown in Fig. 6, which delineates the coefficients for each variable with the p-values shown in Fig. 7. The coefficient of the number of likes, as shown by the green line, is consistently close to zero across all price ranges, suggesting that likes have minimal impact on consumer purchasing behavior. This result refutes our hypothesis H1a, a positive correlation between the number of likes and purchase intention across price ranges. The red line in Fig. 6 represents the coefficient of the number of comments, indicating the significance of the items priced below ¥2,000. However, this impact diminishes as the price rises and finally tends to zero, suggesting that, as the price of the product increases, the impact on potential customers also diminishes.
Nonetheless, the graphical representation also shows a turning point, in which the effect of comments rises briefly before continuing to decline. This turning point suggests that consumer comments may momentarily regain influence over certain price ranges, particularly mid-range items, potentially reflecting heightened buyer caution at certain price thresholds. Future analyses could explore this phenomenon and its relationship with price-driven buyer behavior. These results only partially support hypothesis H1b, which states that comments significantly affect purchase intention, mainly at low price levels, and that their effect diminishes as price increases.
The Regression analysis shows different coefficients for different units, which may affect their comparability. Because of the focus of this study, logarithmic transformations are not used to address this issue. Instead, we interpret the coefficients within the context of their respective units. This approach maintains the original scale of the data, making the results more intuitive and directly applicable to real-world situations. By understanding the coefficients in their original units, we can communicate the findings more effectively to practitioners who can implement the insights without adjusting for the transformed variables. This decision allows us to provide direct, actionable insights based on raw, untransformed data.
To enhance the discussion, we consider why price points affect the influence of comments and likes differently. Our results show that prices distinctively affect social-proof mechanisms. Specifically, for items priced below ¥2,000, comments significantly positively affect purchase intention, suggesting that potential buyers place higher value on detailed feedback for low-priced items. The impact of comments diminishes as price increases, indicating that higher-priced items may require additional signals such as brand reputation, product authenticity, or more emotionally connected descriptions rather than relying solely on social proof.
By contrast, the impact of likes was consistently lower across all price ranges. This consistency suggests that likes are less informative or persuasive than comments, regardless of price. The consistent minimal influence of likes implies that buyers do not view them as strong indicators of product quality, even for low-priced items. Combining these findings, we conclude that social proof, such as comments, is a more valuable source of trust at lower price points, likely because of lower perceived risk. As prices rise, consumers may require stronger and more reliable evidence, beyond likes or comments, to justify their purchases, such as brand reputation or emotionally rich product descriptions. This nuanced consumer behavior demonstrates that
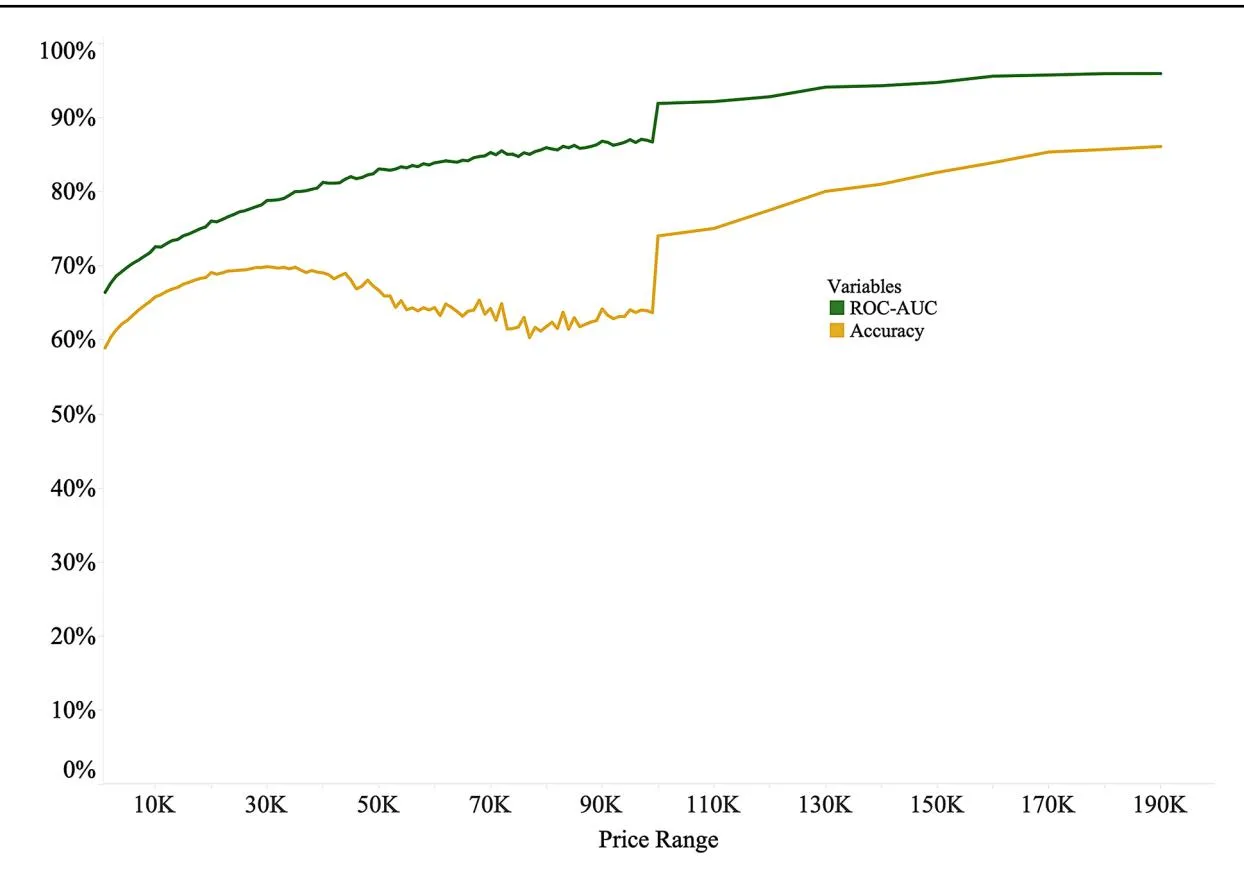
Fig. 5 Dynamic of model predictive power across price ranges
while likes and comments are important social proof indicators, their influence on purchase decisions is complex and highly dependent on the price range, reflecting the multifaceted nature of consumer decision-making in high-value e-commerce environments.
Similarly, the constant coefficient, marked by the blue line, decreases with increasing prices, indicating a general decline in customers’ baseline purchase intentions for more expensive products. However, there is a notable surge in the coefficient for items priced above ¥100,000. This unexpected increase may reflect unique consumer behavior, in which exceeding a certain price threshold intensifies purchase intentions, possibly because of perceived value or exclusivity. In addition, this augmented coefficient for the constant variable in the high price range is intriguing. This suggests that a premium is placed on factors beyond the tangible aspects of the product, possibly brand prestige or exclusivity associated with high-value goods.
Most notably, the sentiment score coefficient (shown by the orange line) shifts from a negative to a positive value as the price increases and continues to rise beyond this point. Around the ¥60,000–¥70,000 price range, the coefficient experiences a brief drop but rises again once the price exceeds ¥100,000. This fluctuation reflects natural inflection points in consumer decision-making for high-value items, where emotional engagement and trust become critical factors. High-value purchases, defined in this study as products priced above ¥100,000, are often influenced by emotional resonance in product descriptions. Emotional cues can help mitigate consumer uncertainty and build trust, especially when the perceived risk is higher. This pattern aligns with prior research on high-stake purchasing behavior, in which emotional factors have become increasingly important in reducing perceived risk. The consistent rise in the sentiment score coefficient after ¥100,000 supports H2, suggesting that emotionally rich product descriptions significantly affect purchase intentions in the high-value category. The change in the sentiment score coefficient around the ¥100,000 price point highlights the role of context-sensitive emotional content in driving purchasing behavior for higher-priced products, demonstrating that positive emotions in product descriptions can lead to better sales outcomes for high-value items.
In addition, as shown in Fig. 7, the p-values for sentiment scores are consistently low across all price ranges, which supports H3 by demonstrating that positive sentiment within product descriptions significantly affects purchase intentions, with this effect being amplified at higher price points. It is important to clarify the differences between sentiment scores and their coefficients. While sentiment scores range
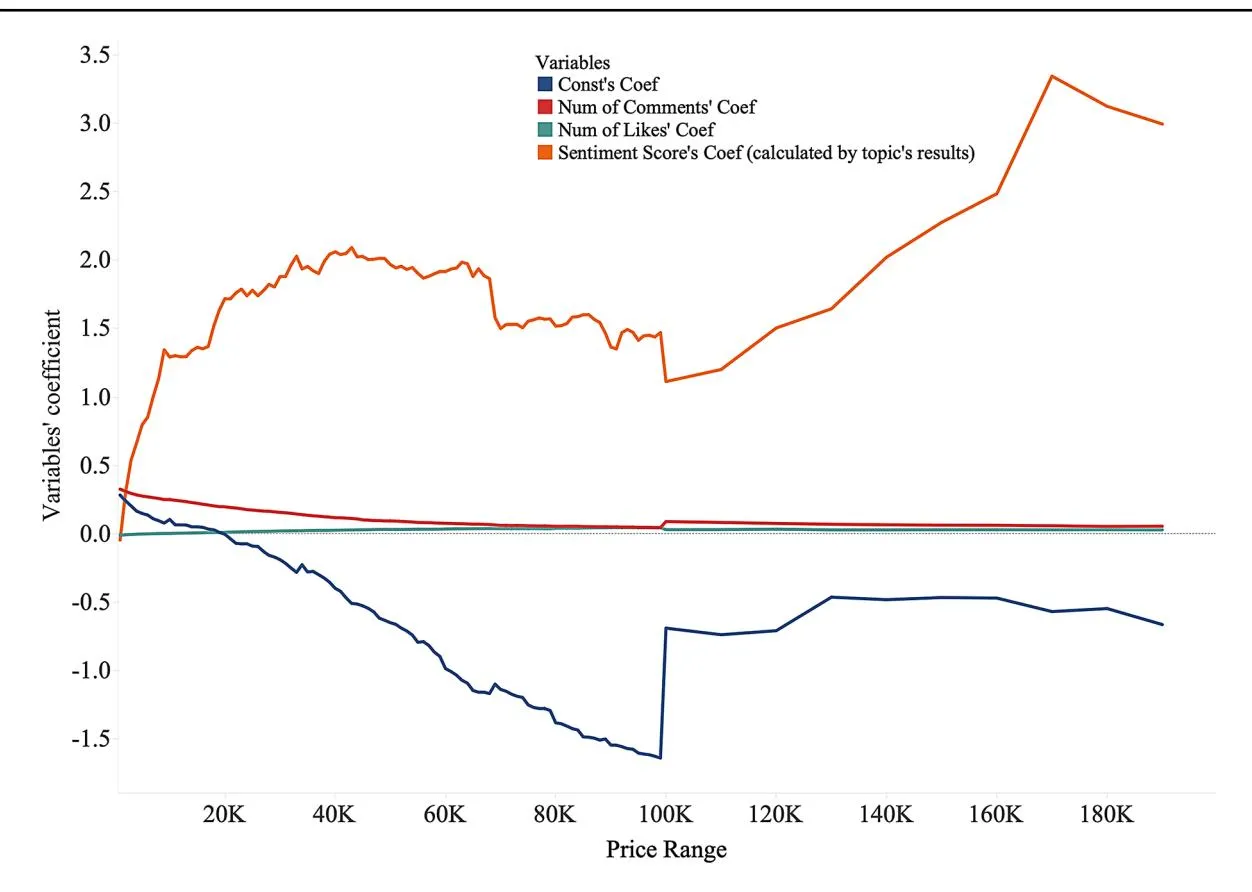
Fig. 6 Variables’ coefficient in the different price range
from 1 to 5, representing a spectrum of emotions from negative to positive, the coefficients measure the impact of these scores on purchase intentions. Our findings indicate that its coefficient increases as sentiment becomes more positive, meaning that positive emotions in product descriptions strongly influence purchase intention. This also suggests that consumers respond more favorably to emotionally rich and positive descriptions, particularly for high-value products. In this context, higher sentiment scores align with a greater positive effect on purchase intentions, meaning that, as the sentiment in the product description becomes more positive, it exerts a stronger influence on the decision-making process. This pattern aligns with theories of consumer psychology that suggest that high-value purchases are driven by rational evaluation and emotional engagement. Consumers tend to rely more on emotional cues in product descriptions to build trust and mitigate uncertainty as the price and perceived risk increase. Therefore, the findings support that positive emotions in product descriptions have a heightened impact on high-value product categories (defined as ¥100,000 or more), where emotional engagement becomes a critical factor influencing purchase behavior.
Figure 8 shows the standard errors for each coefficient. Interestingly, the standard error for sentiment score increases as product prices rise, whereas the other variables remain relatively stable. This variability suggests a stronger but less consistent sentiment impact on purchase intention as item value increases. Statistically, a high standard error indicates that the sample means are spread more around the population mean, suggesting that the sample may not fully represent the population. However, in this case, it reflects the inherent variability in consumer behavior, particularly for high-priced items. As item value increases, consumer decisions are influenced by broader factors, including trust, emotional engagement, and perceived risk. Positive emotions conveyed through product descriptions may interact with these factors in complex ways, contributing to the greater variability in the data. Although higher sentiment scores generally correlate with increased purchase intention, the exact impact of sentiment becomes less predictable at higher price points because of the involvement of these additional factors.
Thus, while a higher standard error signals more variability in the relationship between sentiment and purchase intention, this does not invalidate our conclusion. Instead, it highlights the nuanced nature of high-value purchases in which emotional cues in product descriptions play a more pronounced but less consistent role. In high-value transactions, buyers are often influenced by rational evaluations (e.g., price and product specifications) and emotional
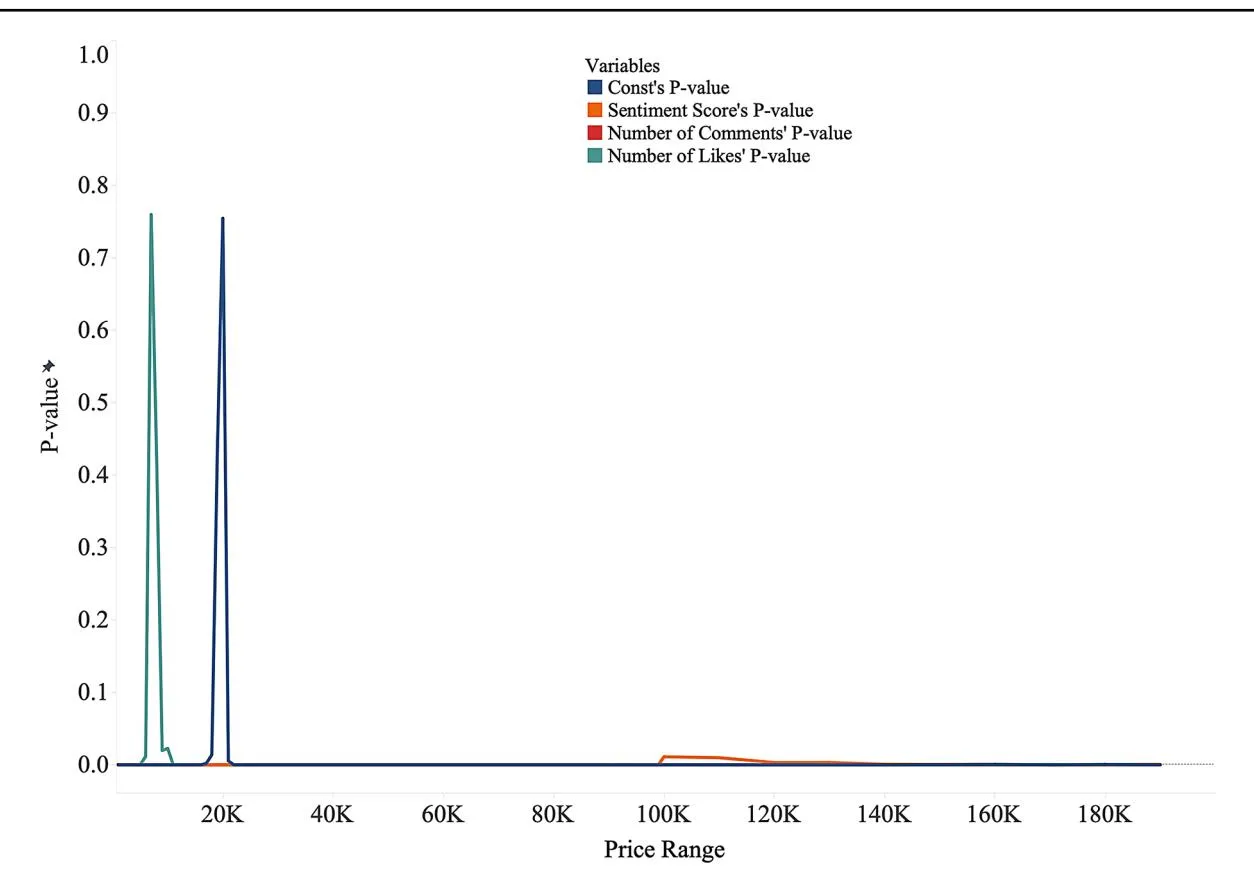
Fig. 7 Variables’ p-value in the different price range
engagement, which may shift the weight of emotional factors relative to other decision-making elements. The high standard error reflects greater variability in how different buyers respond to sentiment cues, suggesting that sentiment remains a significant driver with varying degrees of influence, depending on the specific transaction.
Emotional elements in product descriptions, especially for high-priced items, have emerged as critical factors influencing consumer trust and purchasing decisions. Figure 9 visually demonstrates a theoretical model of how sentiment and price dynamics may influence a buyer’s purchase intentions and seller’s behavior in high-value transactions. In this model, “sales intention” represents a hypothetical concept based on a seller’s anticipation of the market conditions and price movements. This reflects a seller’s potential willingness to delay or expedite the sale of an item depending on the product’s price. For example, sellers may be more inclined to sell quickly at lower prices, anticipating stable or declining prices. Conversely, sellers may become more reluctant to sell at higher prices, expecting the product’s value to rise further, leading to higher returns. This theoretical concept is not directly measured but interprets seller behavior based on price fluctuations.
On the other hand, “purchase intention” refers to a buyer’s willingness to purchase, which is influenced by emotional and trust cues in product descriptions. Consumers will likely become more cautious and deliberate in their purchase decisions as prices increase. However, the urgency to secure a product before future price hikes may also increase the purchase intent in certain cases. Thus, buyer behavior is shaped by a balance between rational evaluation (such as product value) and emotional engagement, where higher prices amplify the need for emotional trust signals to justify the purchase.
This figure illustrates that sentiment becomes increasingly significant as the price of a product increases, suggesting that the emotional resonance in product descriptions is particularly important for higher-priced goods. Simultaneously, the tension between the seller’s “sales intention” (theoretical) and the buyer’s “purchase intention” reveals that the dynamics of high-value transactions are complex and mediated by both emotional and rational factors. This phenomenon also underscores the necessity of sellers and e-commerce platforms to leverage emotional elements in product descriptions to build trust and enhance purchase intentions in high-stake transactions.
In conclusion, this study fills a critical gap in the existing literature by demonstrating how sentiment in product descriptions pivotally shifts consumer decision-making in the high-value e-commerce domain. This section affirms
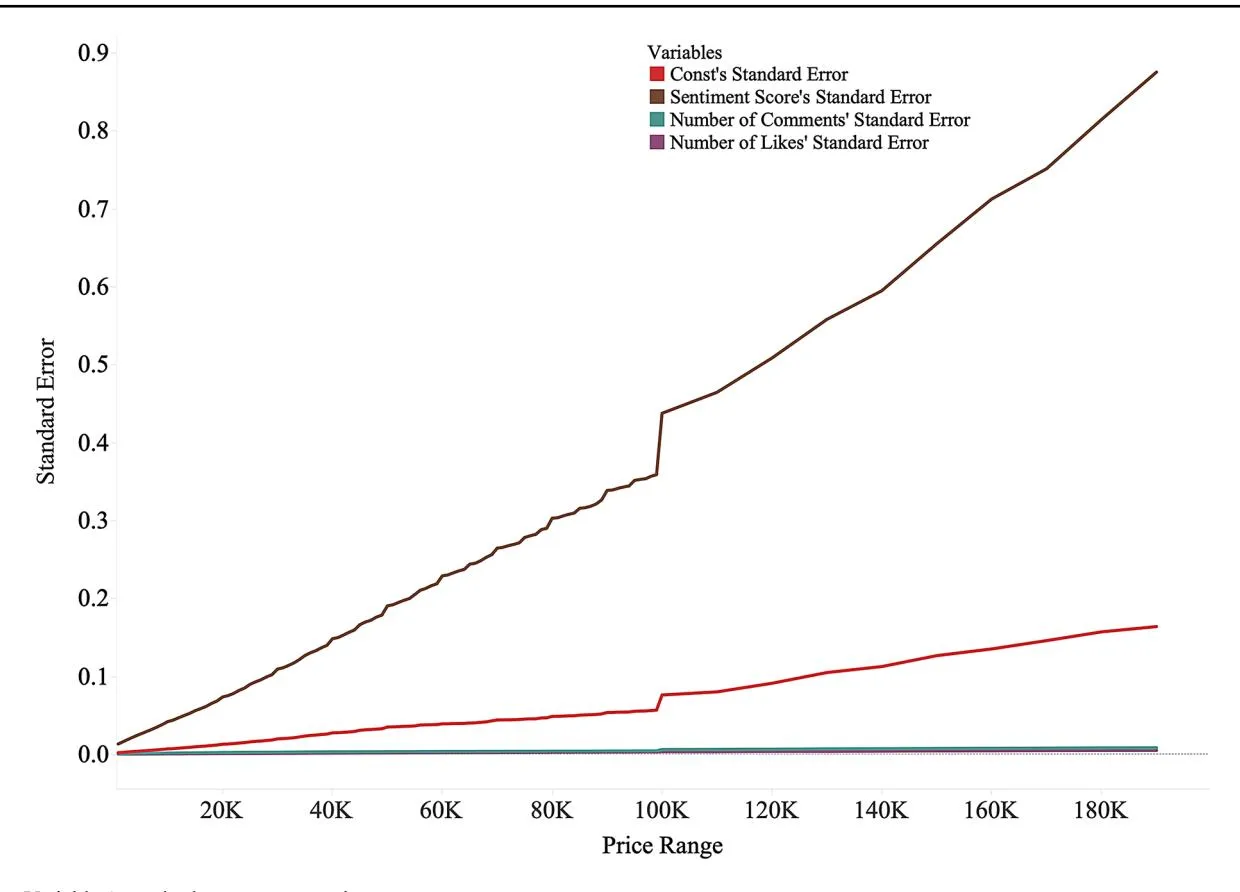
Fig. 8 Variables’ standard errors across price ranges
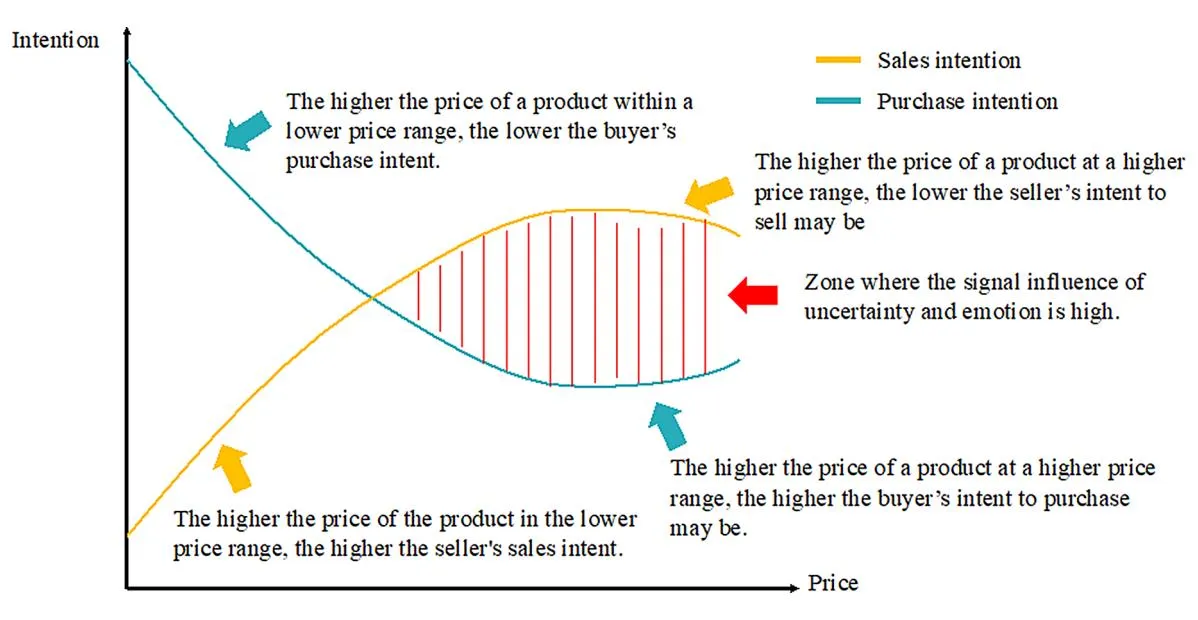
Fig. 9 Sentiment impact gradient on high-value product purchase decisions
the study’s originality and practical implications, advocating for future explorations of the intricate fusion of emotion and commerce, particularly in segments where price points dramatically influence purchasing psychology.
5.3 Evaluation of the proposed methodology
Section titled “5.3 Evaluation of the proposed methodology”The results of our analysis confirmed the hypotheses, revealing that the sentiment scores derived from our new method, SATORE, significantly influence potential customers’
Table 9 Descriptive statistics of sentiment scores (using word-frequency-based sentiment analysis)
| Variables | Min | Median | Mean | Max | Std |
|---|---|---|---|---|---|
| Sentiment score | 0 | 18.88 | 26.85 | 385.42 | 28.81 |
purchase decisions. Importantly, this influence is notably stronger at higher product prices. This finding aligns with consumer behavior research, which shows that contextsensitive emotional content in high-value transactions often plays a pivotal role in reducing perceived risk and building trust.
To address concerns regarding the novelty of our methodology, we conducted additional analyses to compare our approach with the traditional word-frequency-based methods. These comparisons highlight the uniqueness and added value of the proposed methodology. Sentiment scores were recalculated using traditional word-frequency methods, and the predictive model performance differences were assessed. The comparative results demonstrate that, while traditional methods generally provide baseline insights, our new method offers enhanced predictive power, particularly in discerning the nuanced influences of sentiment in highpriced product categories. The results also support the argument that high-value transactions demand more complex and context-aware analysis methods to capture the emotional subtleties that drive consumer trust and purchasing behavior. This finding substantiates the method’s unique contribution beyond the existing literature, addressing the critical gap identified by the reviewer regarding the empirical validation of the method’s efficacy across pricing tiers.
Table 9 presents the results of the descriptive statistics obtained by directly calculating sentiment scores. The sentiment scores are high after removing the effects of the results using context information. The logistic regression model is again performed in different price ranges, and the output of the sentiment score is illustrated in Fig. 7.
Figure 10 shows the P-values of the sentiment scores calculated using word frequency. Our analysis reveals that word-frequency-based sentiment analysis loses explanatory power at higher price ranges, particularly beyond the ¥100,000 threshold, and becomes insignificant at ¥130,000. Thus, while a higher standard error signals more variability in the relationship between sentiment and purchase intentions, this does not invalidate our conclusion. Instead, it highlights the nuanced nature of high-value purchases, in which emotional cues in product descriptions play a more pronounced but less consistent role. In high-value transactions, buyers are often influenced by rational evaluations (e.g., price and
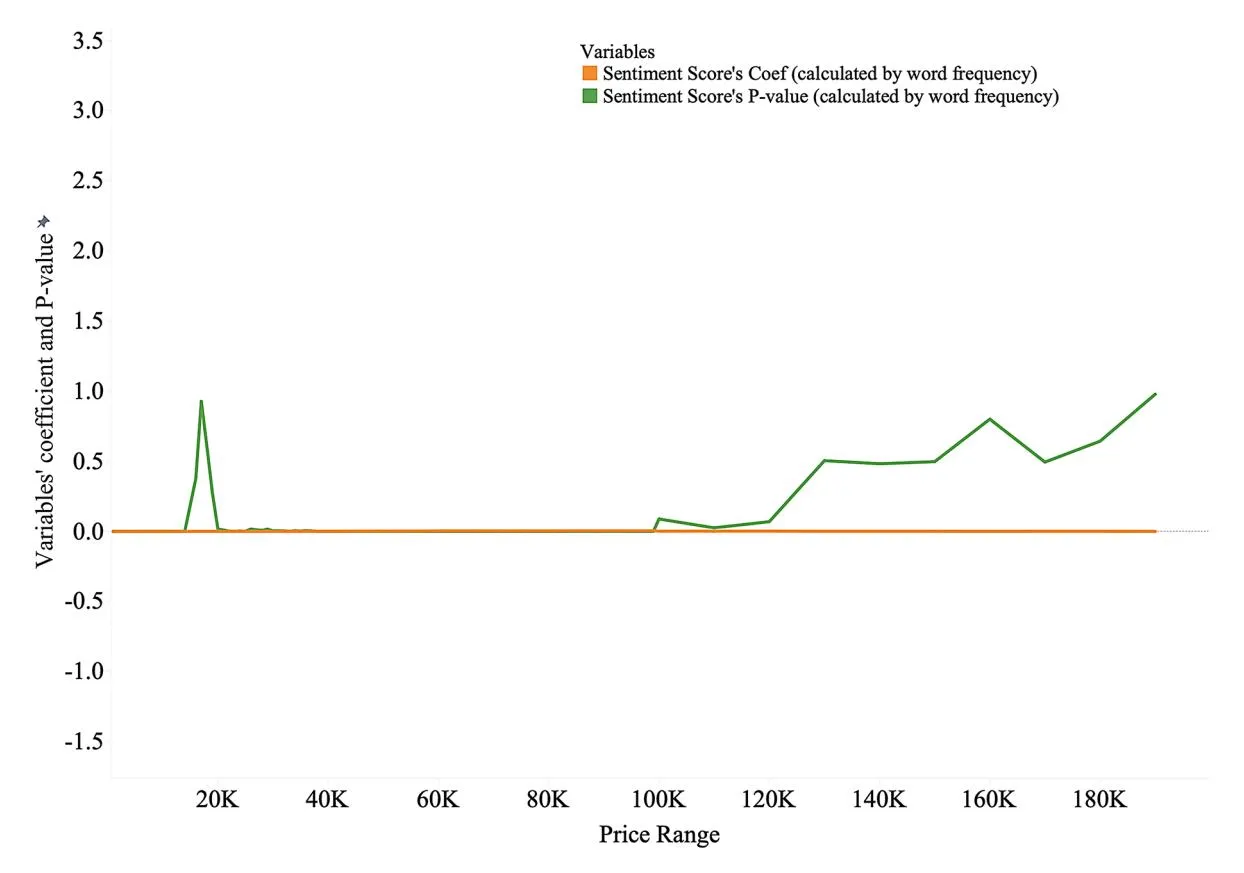
Fig. 10 Sentiment score coefficients across different price ranges. The red box highlights the threshold of ¥100,000, where the sentiment score shows a significant shift in its impact on purchase intentions
product specifications) and emotional engagement, which may shift the weight of emotional factors relative to other decision-making elements. The high standard error reflects greater variability in how different buyers respond to sentiment cues, suggesting that sentiment remains a significant driver with varying degrees of influence depending on the specific transaction. This result suggests that the usefulness of the sentiment scores calculated using word frequency is limited to a certain price range. Comparing the results from Figs. 6 and 7, we can conclude that sentiment scores calculated through SATORE are more effective than those calculated through word frequency, which do not vary with price and lose explanatory power in the high-price segment.
To further validate the loss of explanatory power in higher price segments, we conducted additional analyses by adjusting the sentiment scores calculated using word frequency. These adjustments, such as logarithmic transformations and scaling, consistently show diminishing relevance to product sales as prices increase above ¥100,000. This result is consistent with findings from the consumer behavior literature, where higher financial stakes increase the importance of emotional and trust-building cues in purchase decisions, which traditional models fail to account for adequately. To ensure that the loss of explanatory power in the high-price segment is not due to the size of the scores, we performed further analysis by reducing the proportion of the scores calculated by word frequency to approximate the scores calculated by SATORE. Figures 11 and 12 show the logarithm of the sentiment scores and direct division by 1000, respectively, to investigate the effect of these modifications on the logistic regression model results.
Our analysis shows that when the values are reduced or logarithmically taken, the p-values in the model also become larger in the higher price bands above ¥100,000, indicating a continuing loss of relevance to product sales-Figs. esults in Figs. 5, 6, 7, 8, 9, 10, 11 and 12 provide strong empirical support for our conclusion that sentiment in product descriptions plays a critical role in consumer decisions. However, its accurate measurement requires advanced methods such as SATORE, particularly in high-price segments. These advanced methods capture the complexity of emotional engagement in high-value transactions, offering deeper insights than traditional word frequency-based models. However, our study also highlights the greater effect of first summarizing the information in the text using SATORE to calculate sentiment scores rather than relying solely on word frequency.
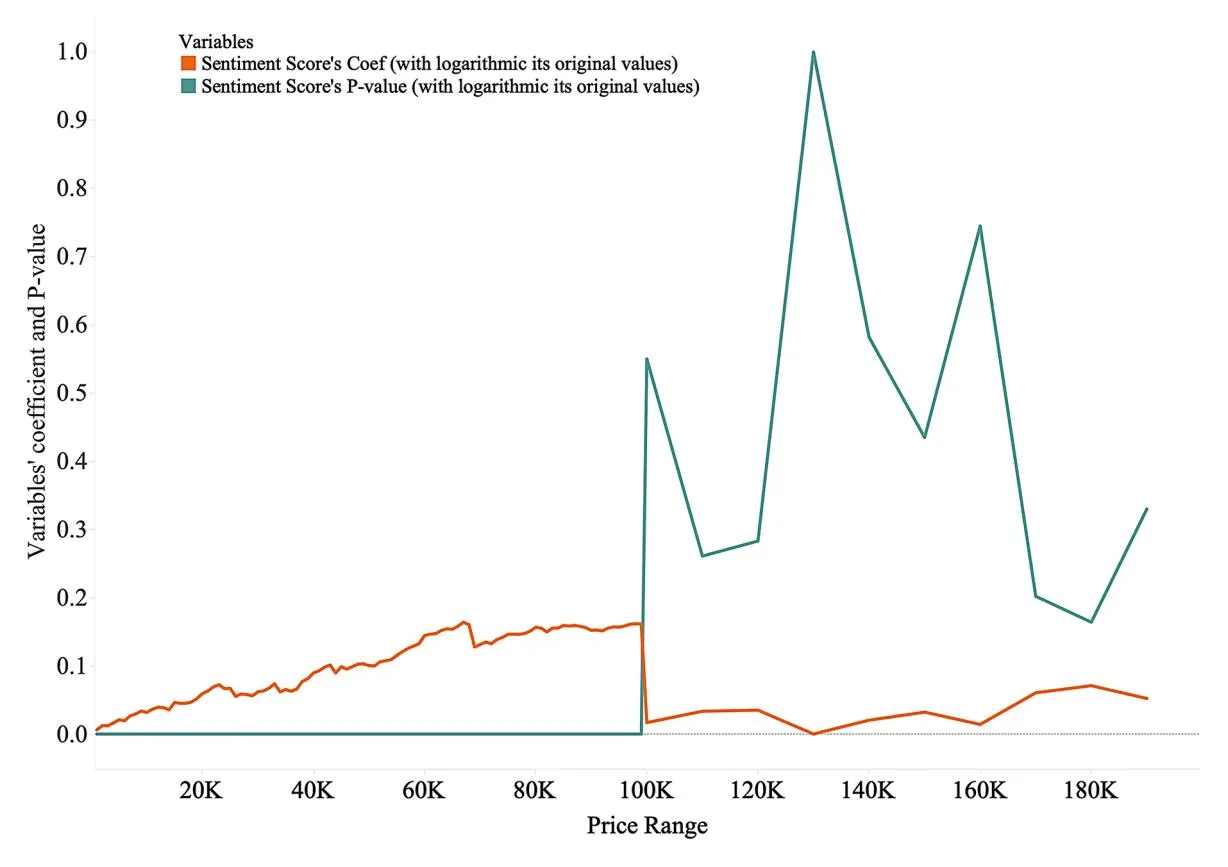
Fig. 11 The coefficient and p-value of sentiment score calculated by word frequency and with logarithmic its value
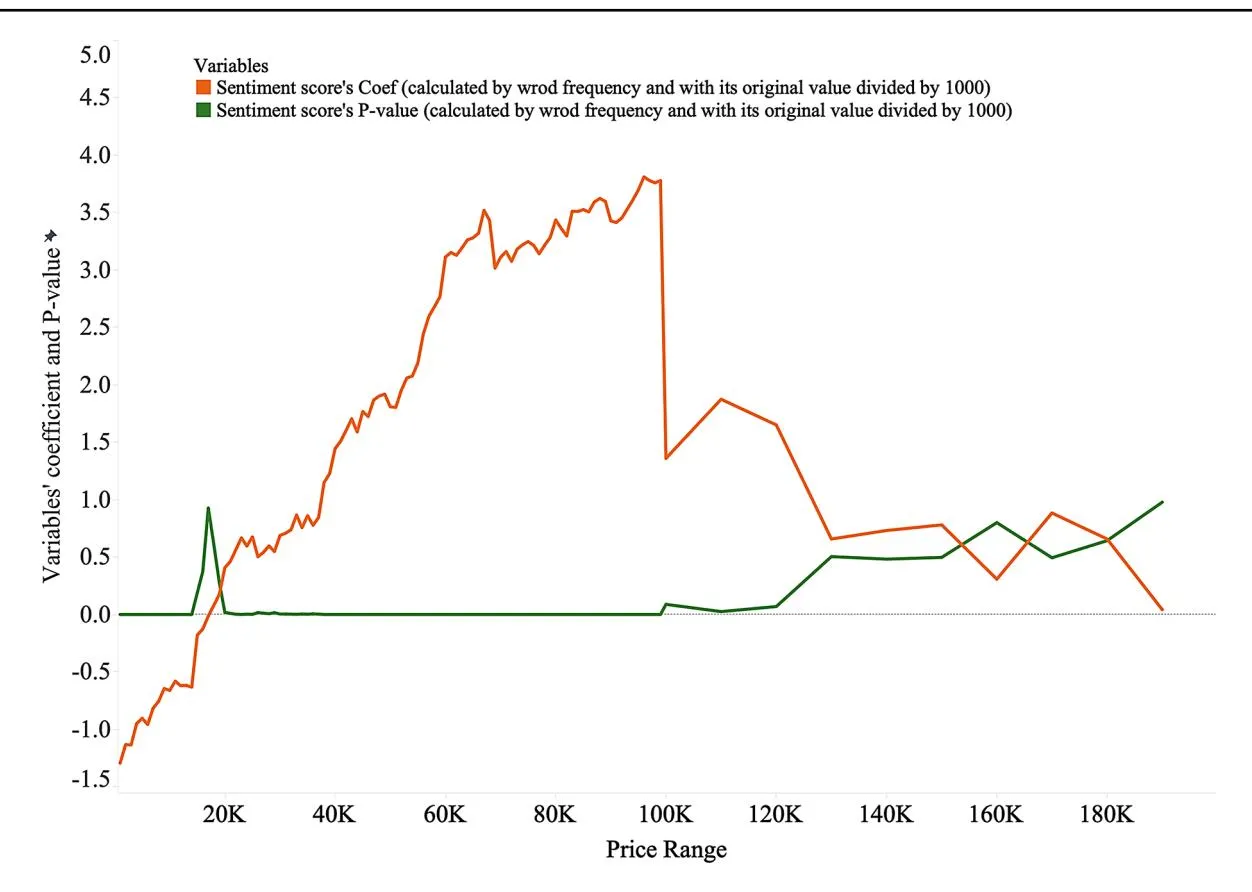
Fig. 12 Coefficient and p-value of sentiment score calculated by word frequency and divided by 1000
6 Conclusion
Section titled “6 Conclusion”6.1 Theoretical contributions
Section titled “6.1 Theoretical contributions”This study empirically analyzes the impact of product descriptions and their sentiment components on consumer purchase intentions in a C2C e-commerce context. Using a year of transactional data from Mercari, we find that product descriptions significantly influence buyer decisions, with the impact of sentiment increasing as product prices increase.
This study highlights the critical role of sentiment in the product description on C2C platforms. Our analysis shows that consumers prefer products with positive emotional descriptions, particularly high-priced items. This effect is less pronounced for lower-priced goods, indicating that emotional engagement is increasingly important in high-value transactions. These findings underscore the need for a deeper understanding of how emotions interact with product information to shape consumer behavior in digital marketplaces.
A key theoretical contribution of this study is the introduction and validation of SATORE, a novel sentimentscoring method using Renyi entropy within the context of topic modeling. This method captures context-sensitive emotional nuances in product descriptions more precisely than traditional word frequency-based approaches, making it particularly effective for high-value transactions. By integrating advanced topic modeling and Renyi entropy, we captured emotional nuances in product descriptions, particularly in the high-value segments. This method improves on previous word-frequency-based approaches by offering a more precise measurement of context-sensitive emotional content, which provides a more comprehensive understanding of how emotional and cognitive elements interact in purchasing decisions. These results, when incorporated into the regression model alongside traditional metrics such as comments, likes, and pricing, shed light on the combined influence of these factors on sales outcomes. The robustness of this methodology across varying price ranges attests to its predictive power and utility in untangling consumer purchasing patterns.
This study extends the previous works of Sun et al. (2022) and Sun et al. (2024) by introducing an enhanced sentiment scoring method that uses SATORE to capture nuanced emotional signals in product descriptions. While Sun and Ohsawa explored the role of product descriptions in building trust, our research delves deeper into how emotional content with context-sensitivity in descriptions influences purchasing decisions, particularly in high-value product categories. By providing empirical evidence on the
differentiated impact of sentiment across various price tiers, this study offers a new perspective on trust-building dynamics through emotional content in C2C transactions. This advanced methodology, combined with a large-scale dataset covering millions of transactions, offers new insights into the consumer decision-making process on C2C platforms, especially in high-stakes transactions where emotional engagement plays a critical role.
6.2 Managerial contributions and limitations
Section titled “6.2 Managerial contributions and limitations”For managers of C2C platforms, this study offers valuable insights. It identifies the key elements in product descriptions that significantly influence purchase intentions and provides practical strategies for enhancing transactional success. For example, platforms may consider equipping sellers with sentiment-optimized description templates or developing AI tools that generate emotionally rich product descriptions based on a product’s value. Such tools can analyze the interplay between emotional and factual content to maximize buyer engagement, particularly for high-value items. Additionally, our analysis reveals a price-elastic impact of sentiment on purchase intent, empowering platforms to decode customer reactions across diverse pricing spectra and craft more nuanced marketing strategies that align with the emotional needs of buyers in high-value segments.
However, this study has certain limitations. It focuses solely on sentiment scores in product descriptions and their influence on purchase intent, excluding other potential factors that could enhance the model’s accuracy. Future studies could introduce a broader range of signals, such as brand reputation or user demographics, to more thoroughly dissect the intricacies of purchasing behaviors. Moreover, the dataset used in this study is specific to Mercari, a Japanese C2C platform, which may limit the generalizability of the findings to other marketplaces and cultural contexts. Additionally, the study’s implications are restricted to a singular product category, prompting further exploration of the variability across diverse segments. Finally, the study did not exclude outlier data, such as goods with exceptionally high pricing. Future research could delineate parameters to control for outliers and ensure that the findings apply to a wider range of products.
Acknowledgements This research is part of the results of Value Exchange Engineering, a joint research project between R4D, Mercari, Inc., and RIISE, University of Tokyo. This study is also partly supported by JSPS Kakenhi 20K20482.
Funding Open Access funding provided by The University of Tokyo.
Data availability The datasets generated and/or analyzed in this study are not publicly available because of the policies of the companies providing the data and users’ privacy concerns.
Declarations
Section titled “Declarations”Conflict of interest On behalf of all the authors, the corresponding author declares that no conflicts of interest or personal relationships could have influenced the work reported in this article.
Open Access This article is licensed under a Creative Commons Attribution 4.0 International License, which permits use, sharing, adaptation, distribution and reproduction in any medium or format, as long as you give appropriate credit to the original author(s) and the source, provide a link to the Creative Commons licence, and indicate if changes were made. The images or other third party material in this article are included in the article’s Creative Commons licence, unless indicated otherwise in a credit line to the material. If material is not included in the article’s Creative Commons licence and your intended use is not permitted by statutory regulation or exceeds the permitted use, you will need to obtain permission directly from the copyright holder. To view a copy of this licence, visit http://creativecommons.o rg/licenses/by/4.0/.
References
Section titled “References”- 1. Ninomiya T, Toriumi F, Zaitsu H, Miyake Y (2021) Analysis of User Behavior in a C2C Platform during COVID-19 Pandemic, in 2021 International Conference on Data Mining Workshops (ICDMW): IEEE, 878–881. https://doi.org/10.1109/ICDMW534 33.2021.00114
- 2. Chen J, Zhang C, Xu Y (2009) The role of mutual trust in Building members’ loyalty to a C2C platform provider. Int J Electron Commer 14(1):147–171. https://doi.org/10.2753/JEC1086-4415 140105
- 3. Jones K, Leonard LN (2014) Factors influencing buyer’s trust in consumer-to-consumer e commmerce. J Comput Inform Syst 54(4):71–79.https://doi.org/10.1080/08874417.2014.11645724
- 4. Du Y, Wei W, Li X (2011) Research on information asymmetry in C2C e-commerce market, in 2nd International Conference on Artificial Intelligence, Management Science and Electronic Commerce (AIMSEC).IEEE 2337–2340. https://doi.org/10.2991/aeb mr.k.200306.006
- 5. Connelly BL, Certo ST, Ireland RD, Reutzel CR (2011) Signaling theory: A review and assessment. J Manag 37(1):39–67. https://d oi.org/10.1177/0149206310388419
- 6. Gregg DG, Walczak S (2010) The relationship between website quality, trust and price premiums at online auctions. Electron Commer Res 10:1–25. https://doi.org/10.1007/s10660-010-904 4-2
- 7. Mavlanova T, Benbunan-Fich R, Koufaris M (2012) Signaling theory and information asymmetry in online commerce. Inf Manag 49(5):240–247. https://doi.org/10.1016/j.im.2012.05.004
- 8. Liberti JM, Petersen MA (2019) Information: hard and soft. Rev Corp Finance Stud 8(1):1–41. https://doi.org/10.2139/ssrn.32528 69
- 9. Jiang C, Han R, Xu Q, Liu Y (2020) The impact of soft information extracted from descriptive text on crowdfunding performance. Electron Commer Res Appl 43:101002. https://doi.org/10 .1016/j.elerap.2020.101002
- 10. Sun Y, Ohsawa Y (2022) The impact of product descriptions on customers’ trust in sellers and purchase intention, in IEEE International Conference on Big Data (Big Data). IEEE 1930–1935. h ttps://doi.org/10.1109/BigData55660.2022.10020527
- 11. Sun Y, Sekiguchi K, Ohsawa Y The impact of sentiment scores extracted from product descriptions on customer purchase
- intention, New generation Computing, 2024/02/24 2024, https:/ /doi.org/10.1007/s00354-024-00242-9
- 12. Petty RE, Cacioppo JT (1986) The elaboration likelihood model of persuasion. In: Petty RE, Cacioppo JT (eds) Communication and persuasion: central and peripheral routes to attitude change. Springer New York, New York, NY, pp 1–24
- 13. Blei DM, Ng AY, Jordan MI (2003) Latent dirichlet allocation. J Mach Learn Res 3:993–1022.
- 14. Spence M (2002) Signaling in retrospect and the informational structure of markets. Am Econ Rev 92(3):434–459. https://doi.or g/10.1257/00028280260136200
- 15. Kardes FR, Posavac SS, Cronley ML (2004) Consumer inference: A review of processes, bases, and judgment contexts. J Consumer Psychol 14(3):230–256. https://doi.org/10.1207/s15327663jcp14 03\_6
- 16. Rindova VP, Williamson IO, Petkova AP, Sever JM (2005) Being good or being known: an empirical examination of the dimensions, antecedents, and consequences of organizational reputation. Acad Manag J 48(6):1033–1049. https://doi.org/10.5465/A MJ.2005.19573108
- Ter Huurne M, Ronteltap A, Corten R, Buskens V (2017) Antecedents of trust in the sharing economy: A systematic review. J Consumer Behav 16(6):485–498. https://doi.org/10.1002/cb.166 7
-
18. Lee K, Lee B, Oh W (2015) Thumbs up, sales up? The contingent effect of Facebook likes on sales performance in social commerce. J Manage Inform Syst 32(4):109–143. https://doi.org/10.1 080/07421222.2015.1138372
-
19. Chang HH, Lu Y-Y, Lin SC (2020) An elaboration likelihood model of consumer respond action to Facebook second-hand marketplace: impulsiveness as a moderator. Inf Manag 57(2):103171. https://doi.org/10.1016/j.im.2019.103171
-
20. Bente G, Baptist O, Leuschner H (2012) To buy or not to buy: influence of seller photos and reputation on buyer trust and purchase behavior. Int J Hum Comput Stud 70(1):1–13. https://doi.o rg/10.1016/j.ijhcs.2011.08.005
-
- Thierer A, Koopman C, Hobson A, Kuiper C (2015) How the internet, the sharing economy, and reputational feedback mechanisms solve the lemons problem. U Miami L Rev 70:830. https:// doi.org/10.2139/ssrn.2610255
-
22. Li X, Guo X, Wang C, Zhang S (2016) Do buyers express their true assessment? Antecedents and consequences of customer praise feedback behaviour on Taobao. Internet Res 26(5):1112– 1133. https://doi.org/10.1108/IntR-03-2015-0063
-
23. Liu Y (2006) Word of mouth for movies: its dynamics and impact on box office revenue. J Mark 70(3):74–89. https://doi.org/10.15 09/jmkg.70.3.074
-
24. Chintagunta PK, Gopinath S, Venkataraman S (2010) The effects of online user reviews on movie box office performance: accounting for sequential rollout and aggregation across local markets. Mark Sci 29(5):944–957. https://doi.org/10.1287/mksc.1100.057 2
-
25. Kim RY (2021) When does online review matter to consumers? The effect of product quality information cues, J Electron Commer Res 21(4):1011–1030, https://link.springer.com/article/10.10 07/s10660-020-09398-0
-
26. Zhou MJ, Lu B, Fan WP, Wang GA (2018) Project description and crowdfunding success: an exploratory study, Inf Syst Front 20(2):259–274, https://link.springer.com/article/10.1007/s1079 6-016-9723-1
-
27. Blei DM (2012) Probabilistic topic models. Commun ACM 55(4):77–84.https://doi.org/10.1145/2133806.2133826
-
28. Yamada A, Hashimoto S, Nagata N (2018) A text mining approach for automatic modeling of Kansei evaluation from review texts, in Proceedings of the 7th International Conference on Kansei Engineering and Emotion Research: KEER 2018, 19–22 March
-
2018, Kuching, Sarawak, Malaysia, Springer 319–328. https://do i.org/10.1007/978-981-10-8612-0\_34
-
29. Reisenbichler M, Reutterer T (2019) Topic modeling in marketing: recent advances and research opportunities, J Bus Econ 89(3):327–356 https://link.springer.com/article/10.1007/s11573 -018-0915-7
-
30. Tang J, Meng Z, Nguyen X, Mei Q, Zhang M (2014) Understanding the limiting factors of topic modeling via posterior contraction analysis, in International conference on machine learning: PMLR, 190–198. https://proceedings.mlr.press/v32/tang14.html
-
31. Koltcov S (2018) Application of Rényi and Tsallis entropies to topic modeling optimization. Physica A 512:1192–1204. https://d oi.org/10.1016/j.physa.2018.08.050
-
32. Koltcov S, Ignatenko V (2020) Renormalization Analysis of Topic Models, Entropy (Basel) 22(5):556. https://doi.org/10.339 0/e22050556
-
33. Sun Y, Hayashi T, Ohsawa Y A latent topic analysis framework for Category-Level target promotion in the supermarket. Procedia Comput Sci 192:2170–2179, 2021/01/01/ 2021, https://doi.org/10 .1016/j.procs.2021.08.230
-
34. Fang X, Zhan J (2015) Sentiment analysis using product review data. J Big Data 2(1):1–14. https://doi.org/10.1186/s40537-015-0 015-2
-
35. Situmeang F, de Boer N, Zhang A (2020) Looking beyond the stars: A description of text mining technique to extract latent dimensions from online product reviews. Int J Market Res 62(2):195–215. https://doi.org/10.1177/1470785319863619
-
36. Hu N, Koh NS, Reddy SK (2014) Ratings lead you to the product, reviews help you clinch it? The mediating role of online review sentiments on product sales. Decis Support Syst 57:42–53. https: //doi.org/10.1016/j.dss.2013.07.009
-
37. Qian Y, Jiang Y, Shang J, Chai Y, Liu Y (2023) Why some products compete and others don’t: A competitive attribution model from customer perspective. Decis Support Syst 169:113956. http s://doi.org/10.1016/j.dss.2023.113956
-
38. Fan Z-P, Che Y-J, Chen Z-Y (2017) Product sales forecasting using online reviews and historical sales data: A method combining the bass model and sentiment analysis. J Bus Res 74:90–100. https://doi.org/10.1016/j.jbusres.2017.01.010
-
39. Liu J, Toubia O (2018) A semantic approach for estimating consumer content preferences from online search queries. Mark Sci 37(6):930–952. https://doi.org/10.1287/mksc.2018.1112
-
40. Ansari A, Li Y, Zhang JZ (2018) Probabilistic topic model for hybrid recommender systems: A stochastic variational bayesian approach. Mark Sci 37(6):987–1008. https://doi.org/10.1287/mks c.2018.1113
-
41. Gregg DG, Walczak S (2008) Dressing your online auction business for success: an experiment comparing two eBay businesses. MIS Q 32(3):pp. 653–670.https://doi.org/10.2307/25148860
-
42. Chen X, Ding R, Wei S, Wang P (2023) Understanding and mitigating risks in social commerce: an empirical study from the perspective of signalling theory. Behav Inform Technol 43(10):2195–2215. https://doi.org/10.1080/0144929x.2023.2241 569
-
43. Davies WE, Giovannetti E (2018) Signalling experience & reciprocity to temper asymmetric information in crowdfunding evidence from 10,000 projects. Technol Forecast Soc Chang 133:118–131. https://doi.org/10.1016/j.techfore.2018.03.011
-
44. Mavlanova T, Benbunan-Fich R (2010) Counterfeit products on the internet: the role of seller-level and product-level information. Int J Electron Commer 15(2):79–104. https://doi.org/10.2307/279 19913
-
45. Edwards K (1990) The interplay of affect and cognition in attitude formation and change. J Personal Soc Psychol 59(2):202. ht tps://doi.org/10.1037/0022-3514.59.2.202
-
46. Fabrigar LR, Petty RE The role of the affective and cognitive bases of attitudes in susceptibility to affectively and cognitively based persuasion. Pers Soc Psychol Bull, 25, 3, pp. 363–381, 1999/03/01 1999, https://doi.org/10.1177/014616729902500300 8
-
47. Pullig C, Netemeyer RG, Biswas A Attitude basis, certainty, and challenge alignment: A case of negative brand publicity. J Acad Mark Sci, 34, 4, pp. 528–542, 2006/09/01 2006, https://doi.org/1 0.1177/0092070306287128
-
48. Chaudhuri A (2006) Emotion and reason in consumer behavior. Routledge
-
49. Pham MT, Muthukrishnan AV Search and alignment in judgment revision: implications for brand positioning. J Mark Res, 39, 1, pp. 18–30, 2002/02/01 2002, https://doi.org/10.1509/jmkr.39.1.1 8.18929
-
50. Ahmad SN, Laroche M How do expressed emotions affect the helpfulness of a product review?? Evidence from review?s using latent semantic analysis. Int J Electron Commer, 20, 1, pp. 76–111, 2015/11/15 2015, https://doi.org/10.1080/10864415.201 6.1061471
-
51. Balderjahn I, Lee M, Seegebarth B, Peyer M (2019) A sustainable pathway to consumer Well-Being. The role of Anti‐Consumption and consumer empowerment. J Consum Aff 54(29). https://doi.or g/10.1111/joca.12278
-
52. Chen A, Peng N Antecedents to consumers’ green hotel stay purchase behavior during the COVID-19 pandemic: the influence of green consumption value, emotional ambivalence, and consumers’ perceptions. Tourism Manage Perspect, 47, p. 101107, 2023/06/01/ 2023, https://doi.org/10.1016/j.tmp.2023.101107
-
53. Elliott MT, Speck PS (2005) Factors that affect attitude toward a retail web site. J Mark Theory Pract 13(1):40–51. https://doi.org/ 10.1080/10696679.2005.11658537
-
54. Kim YJ, Han J (2014) Why smartphone advertising attracts customers: A model of web advertising, flow, and personalization. Comput Hum Behav 33:256–269. https://doi.org/10.1016/j.chb.2 014.01.015
-
55. Vermeulen IE, Seegers D (2009) Tried and tested: The impact of online hotel reviews on consumer consideration, Tour Manag 30(1):123–127. https://doi.org/10.1016/j.tourman.2008.04.008
-
56. Nakayama M et al (2021) Japanese Dictionary for Sentiment Analysis of Counselling Text, in Proceedings of the 9th International Conference on Human-Agent Interaction 311–315. https:// doi.org/10.1145/3472307.3484663
-
57. Kudo T, Yamamoto K, Matsumoto Y (2004) Applying conditional random fields to Japanese morphological analysis, in Proceedings of the conference on empirical methods in natural language processing 230–237.
-
58. Nielsen FÅ (2011) A new ANEW: Evaluation of a word list for sentiment analysis in microblogs, arXiv preprint arXiv:1103.2903,