Predicting Online Customer Purchase The Integration Of Customer Characteristics And Browsing Patterns
Keywords: Customer purchase behavior Customer decision journey RFM Graph metrics Predictive analysis Clustering analysis
ABSTRACT
Section titled “ABSTRACT”Despite the relentless growth of online retail, e-commerce platforms still suffer from a low purchase conversion rate. Researchers and practitioners have attempted to understand customer purchase behavior, but it remains elusive due to customers’ heterogeneous and complex decision-making processes. This study addresses a gap in existing research by combining two types of factors affecting purchase behavior: past customer characteristics and current website browsing behavior. This study employs recency, frequency, and monetary value (RFM) to extract variables of customer characteristics and utilizes graph metrics to comprehensively measure browsing patterns. Based on these variables, this study conducts predictive analysis for purchase behavior and clustering analysis for session-level customer segmentation. Our findings reveal that integrating customer characteristics and browsing patterns significantly enhances purchase prediction and proposes a novel customer segmentation. This study not only provides theoretical and methodological contributions to decision support and e-commerce literature but also offers practical insights for real-time personalized marketing strategies.
1. Introduction
Section titled “1. Introduction”In the relentless growth of online retail, the global e-commerce market stands out and is projected to reach an impressive 8.1 trillion dollars by 2026. According to the U.S. Department of Commerce, ecommerce sales constituted 14.6% of retail sales in 2022, marking a growth of 7.7% from the previous year.1 Much of this swift expansion in the e-commerce market can be attributed to the convenience of online shopping. Unlike traditional brick-and-mortar stores, e-commerce platforms offer enhanced accessibility, enticing customers to engage with varied intentions. For instance, online shoppers browse e-commerce websites for product comparisons or to interact with other users, often without a fixed intention to purchase. This myriad of online customer visit intentions has introduced challenges in understanding their behavior, resulting in a purchase conversion rate that is notably lower than that of offline channels [9].
A diminished purchase conversion rate directly translates to a reduction in profits, posing challenges to an e-commerce platform’s sustainability and growth [10,54]. For e-commerce platforms to enhance their conversion rate, predicting purchase behavior and
increasing marketing efficacy by targeting likely buyers are the key [55]. To this end, many marketers have traditionally focused on customer segmentation approaches by estimating customer lifetime value based on customer characteristics such as demographics and past experiences on the e-commerce platform [49,62]. However, given the heterogeneous and complex decision journeys of online customers, the challenge remains: relying solely on features from past experiences may not accurately predict purchase timing of e-commerce customers [30]. This underscores the need for a holistic approach that integrates both historical interactions and real-time browsing behavior2 [53].
In addition to these practical motivations, we motivate our study to bridge a gap in the literature. While online platforms have the capability to monitor and collect past and real-time customer interactions, ranging from transaction records to page visits, prior research primarily splits into two main approaches: one focusing on customer characteristics and another on browsing behavior during the time of visit. The initial research stream has explored the role of customer characteristics in shaping purchase intentions and influencing subsequent buying behaviors [32,49]. Prior studies have shown that past shopping experiences and visit frequency on an e-commerce platform are associated with
https://www.census.gov/retail/mrts/www/data/pdf/ec\_current.pdf. 2 Browsing behavior is defined as every activity interacting with the web interface of online platforms.
purchase intentions [41]. Other literature within this stream has demonstrated that customer characteristics, such as gender, age, and historical purchase-related factors, play a pivotal role in determining subsequent purchase behaviors, including metrics like customer lifetime value [45,62,63]. In contrast, a burgeoning body of research emphasizes the significance of real-time website browsing, a focus that has been amplified by advancements in data collection methods e.g., [26,37,61]. This stream of research unravels how clickstream data, specifically encompassing the number of clicks and duration of browsing behavior, can predict customer behaviors [17,43]. This literature also highlights understanding browsing behavior, wherein customers navigate from casual searches to specific desired products, ultimately influencing their purchase decisions.
Both streams of research offer complementary insights into the customer’s decision-making process. However, there remains a gap in the literature when it comes to synthesizing these insights. While customer characteristics shed light on their implicit product preferences [12,49], browsing behavior helps discern their contemplative actions during website visits [26]. Notwithstanding their complementary nature, there is a lack of research that holistically integrates both customer characteristics and browsing behavior. Additionally, few studies that have attempted to merge these two dimensions often grapple with methodological challenges, primarily stemming from difficulties in collecting website browsing data and unraveling complex patterns [3,43]. While Chaudhuri et al. [9] attempted to analyze both past behavioral characteristics and browsing behavior, their method was limited in analyzing comprehensive browsing patterns3 by its reliance on simple aggregation of browsing behavior. To address these challenges, this study poses the following research questions: (RQ1) how to measure customers’ characteristics and website browsing behavior and (RQ 2) does integrating customers’ characteristics with browsing behavior enhance purchase prediction performance?
Furthermore, this study seeks to redefine customer segmentation strategies. Traditional segmentation approaches have mostly relied on customer characteristics such as demographics and RFM factors [20,49,62]. However, customer-level segmentation does not necessarily reflect a customer’s navigating and stage of decision journeys during the website visit, which may result in limited practical applicability. Therefore, our research also questions*: (RQ 3) can segmentation based on combined customer characteristics and browsing behavior outperform conventional customer characteristic-based segmentation?* To address these questions, this study combined customer characteristics and webpage browsing behavior for 1,191,203 sessions of 109,904 customers. Specifically, we used the recency, frequency, and monetary value (RFM) approach to evaluate customer characteristics from transaction dataset. We then employed graph theory to extract browsing patterns from clickstream (browsing behavior) dataset. Based on the two types of features, we conducted a predictive analysis by using machine learning (ML) and deep learning (DL) models and a clustering analysis by using the K-means clustering algorithm.
This study offers significant implications for research and practice. First, this work provides insights for the decision support literature on purchase behavior prediction by integrating customer characteristics and browsing patterns from different data sources and empirically demonstrating the enhancement in prediction performance for purchase behavior. Second, this study provides methodological insights into the comprehensive extraction of browsing patterns based on graph theory. Third, this study extends the theoretical understanding of customer decision journeys in the e-commerce context. Lastly, our findings on both predictive and clustering analyses provide useful insights into customer behavior in real-time e-commerce environments for formulating personalization strategies such as target marketing and
recommender system.
2. Conceptual background
Section titled “2. Conceptual background”2.1. Customer decision journey: AIDA model
Section titled “2.1. Customer decision journey: AIDA model”In this study, we leverage the AIDA model as an overarching framework to investigate how customer characteristics and browsing behavior can be used to predict purchase behavior. The AIDA model, representing the stages of attention-interest-desire-action [28,52], details the customer decision journey. At the attention stage, customers become aware of information about a particular brand or product. By the interest stage, they develop an interest and form preferences. Subsequently, potential buyers transition from casual browsing to serious consideration, delving into the desire phase. Ultimately, the customer completes the journey with a purchase. This sequential progression underpins the role of growing confidence in a product and trust in the brand, leading to purchase behavior [27,59]. The AIDA model delineates a purchase funnel, offering insights into the dynamics and nuances of the customer decision journey [35], and has been applied to analyze online customer behavior in previous studies [8,58].
The rapid pace of digital transformation has led to evolving customer journeys. Understanding the inherent dynamics, heterogeneity, and fluidity of these journeys is a major research area [30,53]. Specifically, identifying factors that shape purchase behavior has emerged as a key challenge in both practical and research spheres [60]. For instance, before delving into product information online, a customer’s prior experiences—molded by anticipated utility and preferences—guide their likelihood of purchase conversion [27]. Subsequently, additional expected utility is gauged from onsite browsing behavior, culminating in the final purchase decision [29,56]. In this process, customers perform a cost-benefit analysis through their browsing behavior as well as past customer characteristics to make a purchase decision [7]. Therefore, besides acknowledging past product interactions, it is essential to incorporate website browsing patterns from the vantage point of the customer journey. This perspective provides added insights into shoppers’ intentions leading up to the final purchase [11,19].
To address the practical and research gaps, our approach integrates both customer characteristics and browsing behavior, examining them through the lens of the customer decision journey, as illustrated in Fig. 1. While customer characteristics implicitly shape the purchase intention by influencing their overall journey preference, browsing behavior offers an explicit viewpoint as customers explore products. As depicted in Fig. 1, extant studies tend to isolate customer characteristics to predict subsequent purchase behavior and estimate customer lifetime value (CLV), relying on factors such as RFM [49], or focus solely on webpage navigation (i.e., clickstream) data to predict purchase behavior [26]. However, given that customers’ preferences and purchase intentions evolve from their past experiences and their onsite browsing behavior mirrors their immediate interests and desires, recognizing the synergy between past experiences and current browsing behavior becomes pivotal. This combined approach is not just theoretically significant but also enhances purchase predictions at the time of customer visit and customer segmentations in the e-commerce context.
2.2. Customer characteristics
Section titled “2.2. Customer characteristics”Customer characteristics on e-commerce platforms encompass varied attributes and accumulated data points associated with individual users on the platforms. These characteristics can offer insights into their preferences, behaviors, and potential future actions [27]. Even within the same e-commerce platform, different customers exhibit diverse characteristics based on past interactions, including historical purchases, visit frequency, and amount spent [40]. Such characteristics play a pivotal role in comprehending subsequent customer mindsets and behaviors [44]. For instance, customer attributes like gender, age, and
3 Browsing patterns indicate the directional and sequential pathways that a customer follows while navigating a website.
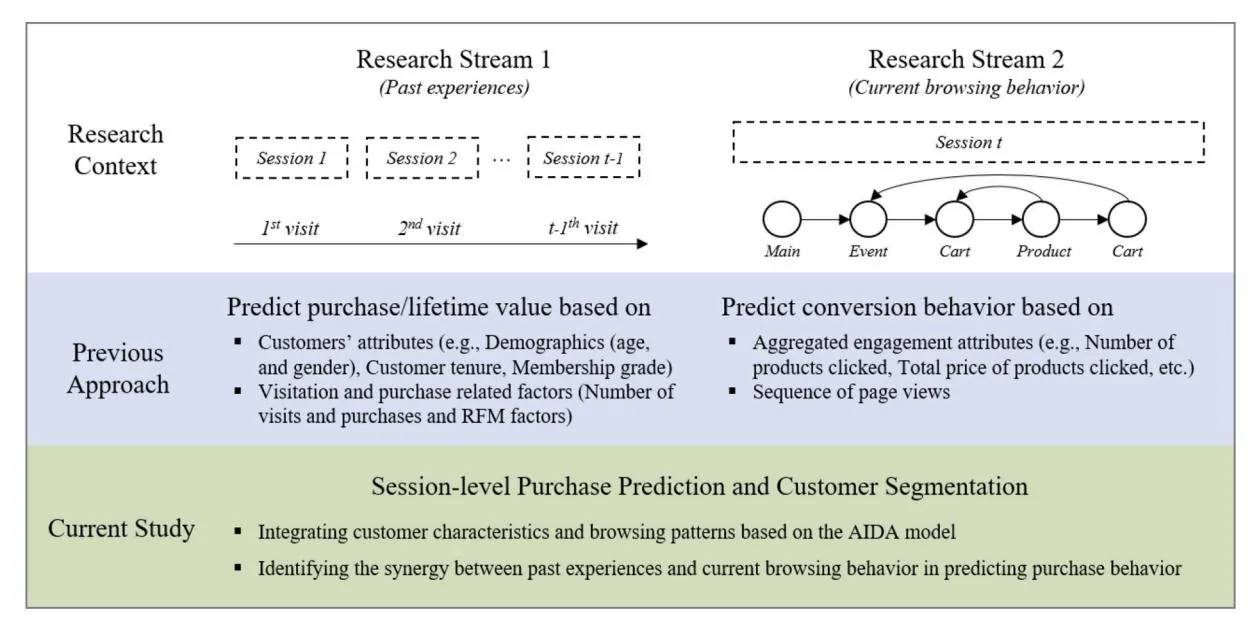
Fig. 1. Summary of current study and limitation in previous approach.
past purchase history indirectly influence customer preferences and purchase behavior [15].
Viewed through the lens of the AIDA model, customer characteristics exert an implicit influence across all stages. Customers at each stage are distinctively funneled and influenced by their past experiences. During the attention and interest stages, customers become aware of and develop an interest in certain brands or products based on factors like shopping inclinations [8]. Such tendencies can be informed and modeled by previous purchase experiences and demographic factors [27]. Supporting this, prior research has shown that attributes related to past purchase experiences, such as the products bought and the number of purchases, correlate with product awareness and significantly impact purchase behavior [57,63]. Various statistical techniques have been developed and used to derive significant features from customer characteristics (i.e., purchase and visitation history), aiming to understand customer behavior from multiple perspectives and thereby boosting predictability [14,20]. Among these approaches, the RFM model has been extensively employed and is proven significant for predicting subsequent customer purchase behavior and segmenting customers based on lifetime values [49,62].
However, while customer characteristics aid in segmentation and in understanding unique cluster attributes and long-term behavior trends, it is not effective to capture real-time behavioral insights, such as predicting when a purchase will occur [62]. A customer’s historical data offers only an cumulative overview, neglecting the nuances and dynamics of individual visits. Such constraints diminish targeted marketing opportunities and compromise the precision of purchase predictions.
2.3. Browsing behavior
Section titled “2.3. Browsing behavior”Customers on e-commerce platforms interact with web interfaces for various reasons, including searching for products, comparing products, making purchases, and communicating with other users. Such interactions, or website browsing behaviors, play a crucial role in customers’ online shopping [9]. The literature has shown that customers’ website browsing behaviors can be divided into exploratory and goaldirected behaviors depending on their visiting intents [18,42]. While exploratory behavior is characterized by aimless browsing without a specific purchase goal, goal-oriented behavior is deliberate, with clear intentions to search for product information to achieve a specific aim (i. e., purchase). Thus, analyzing a visitor’s website browsing patterns can unveil these intentions, aiding in predicting their shopping behaviors [11].
From the perspective of the AIDA model, understanding browsing patterns of customers can explicitly offers insights into a customer’s progression from attention and interest to desire. As customers traverse the stages of the AIDA model, their browsing becomes more targeted. They shift from casual browsing in the early stages to focused consideration, spending more time on and revisiting a select few products that draw their interest [16]. For instance, customers’ revisiting a product page or comparing it to competitors are positively associated with purchase tendencies [38]. In a similar context, recent research has employed the AIDA model as a framework to anticipate purchase behavior by analyzing webpage browsing patterns [35]. Furthermore, Sun et al. [53] endeavored to discern a customers’ journey stage using their omnichannel browsing behaviors, grounding the approach in the AIDA model.
Information foraging theory (IFT) also elucidates the connection between customers’ webpage browsing and purchasing behaviors [48]. IFT posits that information retrieval strategies evolve in response to the surrounding information landscape, drawing on the idea of patchfeeding relationships [51]. It involves sifting valuable information from “patches” (e.g., webpages) and assimilating it—a process termed an “information diet” [47]. Leveraging IFT, recent studies have demonstrated the positive influence of distinct website browsing behaviors on purchasing [38]. Thus, our study synergies customer characteristics and browsing patterns to deepen comprehension of customer decision journey, thereby increasing predictability of purchase behavior.
2.4. Literature on customer purchase prediction
Section titled “2.4. Literature on customer purchase prediction”Table 1 provides a detailed review of prior literature focused on predicting purchase behavior. As discussed in earlier sections, two primary streams of literature have emerged within the literature on this topic. The first stream leverages customer characteristics to forecast purchase behavior. These studies mostly centered on features extracted from past purchase experiences, including customers’ buying and visitation habits, such as RFM [12,49]. By tapping into a wide range of customer characteristics, this research stream has also conducted various customer segmentations for marketing purposes [49]. However, this approach possesses a noticeable limitation when it comes to
Table 1 Key literature on purchase behavior prediction.
| Reference | Approach | Algorithms | Applications | ||
|---|---|---|---|---|---|
| Customer Browsing characteristics patterns | |||||
| Esmeli et al. [12] | Number of previous purchases, number of previous sessions, and day of visit | – | RT, DT, Bagging, DNN | – | |
| Rahim et al. [49] | Recency, frequency and monetary value | – | DT, SVM, MLP | Customer segmentation | |
| Mokryn et al. [43] | – | Dwell time and number of clicks in a session | LR, Bagging, NB, XGB | – | |
| Koehn et al. [26] | – | Sequence of page views | LR, RF, GBM, MLP, GRU, LSTM | Potential order value, revenue gain charts | |
| Baumann et al. [3] | – | Graph metrics (e.g., Number of nodes, eigenvector, self-loops, density, etc.) | GLM, RF, GB | – | |
| Chaudhuri et al. [9] | Customers’ attributes (e.g., customer account score, customer tenure, number of payments, etc.) | Platform engagement attributes (e. g., number of products clicked, total price of products clicked, etc.) | DT, RF, SVM, ANN, DNN | – |
Note. Traditional machine learning models: logistic regression (LR), generalized linear model (GLM), support vector machine (SVM), decision tree (DT), random forest (RF) and XGBoost (XGB).
Deep learning models: artificial neural network (ANN), multi-layer perceptron (MLP), deep neural network (DNN), long short-term memory (LSTM) and gated recurrent unit (GRU).
predicting purchase behavior during a specific visit.
In contrast, the second stream delves into the intricate website browsing behaviors on e-commerce platforms, aiming to predict purchase behavior during the visit [26,43]. These investigations have adopted diverse approaches to quantify browsing patterns by utilizing clickstream data. For instance, Mokryn et al. [43] used aggregated features of browsing, such as the number of clicks and the total dwell time per session. Conversely, Koehn et al. [26] proposed using a sequence of page views as input for an LSTM, a deep learning model specifically crafted for processing sequential data. However, there are challenges: the straightforward aggregation struggles to capture the nuances of website browsing patterns, and using page-view level sequence data encounters difficulties when integrating features from different modalities. Baumann et al. [3] demonstrated the efficacy of purchase predictions by analyzing browsing patterns with a graph metrics approach, capable of encapsulating the dynamics of browsing behavior at the session level, sidestepping the pitfalls of simple aggregation and sequence data techniques.
However, prior studies have separately addressed customer characteristics and browsing behavior, with few attempts to bridge these two streams. Chaudhuri et al. [9] stands out as an exception, endeavoring to amalgamate customer characteristics with browsing behavior. Yet, their study fell short as it did not comprehensively address the dynamics of browsing behaviors by simply aggregating clickstream data. Moreover, no endeavors have been made to examine session-level customer segmentations based on customer characteristics and browsing patterns for marketing applications [12,43]. Drawing on the AIDA model, our study emphasizes the integration of customer characteristics and browsing patterns to provide a holistic perspective of the customer decision journey. Our approach not only augments the predictability of purchase behavior but also paves the way for nuanced customer segmentations in the e-commerce platforms.
3. Methodology
Section titled “3. Methodology”3.1. Research procedure and context
Section titled “3.1. Research procedure and context”This study consisted of three stages for session-level purchase prediction behavior and customer segmentation. Fig. 2 depicts a summary of our research procedure. In short, this study derives the purchase conversion probability through predictive analysis and session-level segmentations through clustering analysis to suggest personalized marketing strategies.
Step 1 uses transaction dataset to extract customer characteristics and clickstream dataset to extract browsing patterns. Data cleaning of URL filtering and preprocessing to remove unnecessary log data, such as missing value and outlier sessions, are performed in the clickstream dataset for predictive modeling. Based on these datasets, Step 2 is to select features of customer characteristics and browsing patterns as well as baseline features. Specifically, we used RFM analysis and graph theory to extract RFM factors as customer characteristics and graph metrics as browsing patterns, respectively. The train and test datasets are separated into a 7:3 ratio. Validation dataset is used for learning verification, and test dataset is used for evaluation. Furthermore, different scenarios are configured to assess the combination variable in purchase prediction performance. Step 3.1 predicts session-level purchase behavior based on customer variables using ML and DL algorithms. We compare the prediction results, using the evaluation metrics of recall, F1-score, and ROC (receiver operating characteristics) curve that have been widely used for imbalance in dependent variable. Step 3.2 also integrates features for both customer characteristics and browsing patterns to segment customers at the session level. In this step, we compare this segmentation result with a customer characteristics-based segmentation approach and then interpret the result for marketing applications.
Our study utilized transaction and clickstream data spanning six months, from January to June 2020, obtained from an anonymous ecommerce platform in South Korea. The platform addresses a diverse range of products, such as apparel, cosmetics, and groceries, across PC and mobile app channels. The transaction data encompasses customer demographics and the purchase and visitation history of each customer. The clickstream data captures page views accompanied by customer session details (e.g., user ID, session ID, browser, page URL, time spent on each page). These sessions are defined within a 30-min window, constituting a single session. The final dataset used in the analyses comprises 109,904 unique customers, 1,191,203 sessions with 28,198,540 page views and a purchase session rate of 8.30% (Table 2).
3.2. Feature extraction
Section titled “3.2. Feature extraction”3.2.1. Customer characteristics: RFM factors
Section titled “3.2.1. Customer characteristics: RFM factors”This study analyzes customer characteristics about customer purchase and visitation history by using the transaction dataset. Given the RFM analysis has been widely used to estimate CLV and understand subsequent customer behaviors (e.g., periodicity of visits and purchases) based on past experiences [14,44,62], we employ the RFM approach to extract factors for customer characteristics on the e-commerce platform. Specifically, this study extracts five variables as RFM factors based on the customers’ transaction dataset at 8-week intervals as follows: Recency Visit indicates the number of days between the previous visit and the current visit (session access) of a customer, and Recency Value represents the number of days between previous purchase and the current session access of a customer. Frequency Visit (Value) is the number
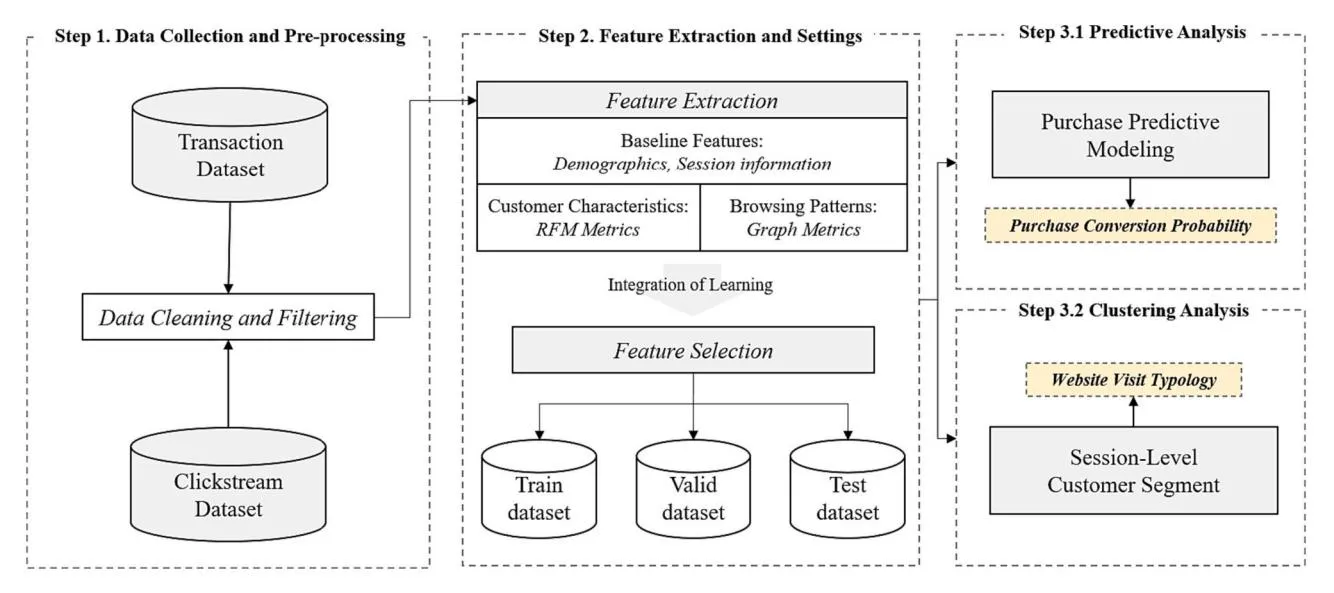
Fig. 2. Research procedure for predictive and clustering analyses.
Table 2 Description and summary of customers and sessions in the datasets.
| Description | Frequency/proportion |
|---|---|
| Number of unique customers | 109,904 |
| Total number of sessions | 1,191,203 |
| Total number of page views | 28,198,540 |
| Proportion of session with a purchase | 8.30% |
of customer visits (purchases) during the past 8 weeks based on the current session access of a customer. Lastly, Monetary Value indicates the cumulative sum of the spending amount during the past 8 weeks based on the current session access of a customer. Furthermore, we extract various baseline features related to customers from the transaction dataset. These features comprise demographics such as the customer’s age and gender and membership information such as tenure, membership grade and E-mail and SMS subscription. These baseline features have been used to predict a customer purchase intention and behaviors [24,50]. Table 3 shows the summary statistics of the variables used in the study and their detailed descriptions in Table A2 of Appendix A.
3.2.2. Browsing pattern: graph metrics
Section titled “3.2.2. Browsing pattern: graph metrics”Online customers have different patterns based on various browsing behaviors involving searching, comparing, and buying products depending on their intentions at the time of visit to the e-commerce platform. These browsing patterns can be captured and recorded by specific combinations of customer actions, such as clicking, scrolling, and searching for shopping events on a website through clickstream data [4]. To measure customer browsing patterns, we analyzed customer actions on a website (i.e., how customers navigate through the site) based on the graph theory [21,37]. In the graph approach, each node represents a webpage (product), and the edges between nodes represent the paths that customers can take from one page (product) to another. For instance, when a customer visits two or more pages in the session, the nodes are sequentially connected by edges to create a graph structure of the session. Given that graph algorithms can identify complex patterns and relationships between nodes [3], customer browsing patterns in a session on the website can be comprehensively expressed as various graph metrics of the graph structure. Prior literature revealed that a significant relationship exists between the graph metrics approach to browsing behavior and purchasing behavior [6,21]. By drawing on the graph approach, we expect to better reflect customer browsing
Table 3 Summary statistics of variables.
| Data source | Variables | Mean | S.D. |
|---|---|---|---|
| Recency_Visit | 7.13 | 14.91 | |
| Recency_Value | 20.94 | 20.58 | |
| Frequency_Visit | 29.38 | 42.63 | |
| Frequency_Value | 6.32 | 10.58 | |
| Monetary_Value | 122,630.06 | 239,016.14 | |
| Transaction dataset | Age | 33.39 | 13.73 |
| Gender | 0.89 | 0.31 | |
| Tenure | 76.57 | 107.27 | |
| Membership grade | 1.02 | 1.03 | |
| 0.43 | 0.50 | ||
| SMS | 0.53 | 0.50 | |
| Product_SelfLoops | 0.22 | 0.57 | |
| Product_FlowHierarchy | 0.55 | 0.45 | |
| Product_Density | 0.43 | 0.46 | |
| Product_Closeness | 0.23 | 0.20 | |
| Product_NodeBetweenness | 0.08 | 0.09 | |
| Product_NeighborDegree | 0.45 | 0.55 | |
| Product_NumberNodes | 4.46 | 7.03 | |
| Product_Eigenvector | 0.07 | 0.14 | |
| Page_SelfLoops | 1.19 | 1.08 | |
| Page_FlowHierarchy | 0.48 | 0.33 | |
| Page_Density | 0.87 | 0.45 | |
| Clickstream dataset | Page_Closeness | 0.43 | 0.08 |
| Page_NodeBetweenness | 0.14 | 0.07 | |
| Session_Length | 10.81 | 14.90 | |
| Ratio_custcenter | 0.00 | 0.03 | |
| Ratio_cart | 0.06 | 0.13 | |
| Ratio_search | 0.04 | 0.10 | |
| Ratio_goods | 0.31 | 0.28 | |
| Time_median | 32.10 | 71.56 | |
| Time_std | 76.43 | 127.64 | |
| Time_min | 10.43 | 47.76 | |
| Time_max | 246.65 | 373.85 |
Note. The number of users is 109,904 and total observation (the number of sessions) is 1,191,203.
patterns, enhancing predictability of purchase behavior.
Prior studies on the website visit intention identified three website visit typologies such as search/deliberation, directed buying, and hedonic browsing [36,42,46]. These website visit typologies can be validated by converting the graph structure of website browsing behavior into graph metrics (see more details in Appendix A). Search/deliberation is a type of search in which customers examine various products before deciding which ones are more appealing [42]. It is characterized
by careful comparative behavior across browsing operations. Flow hierarchy, density, closeness, and eigenvector are some graph metrics related to this typology. Rather than comparing and exploring products, directed buying is characterized to move to their desired product quickly and complete the purchase, and the average amount of time spent on a page is shorter than other types. It exemplifies a high level of goal orientation [42]. This typology can be captured by the number of nodes, flow hierarchy, node betweenness, and neighbor degree. Lastly, customers with hedonic browsing explore product categories over a wide range of areas. Hedonic browsing is related to the number of nodes, selfloops, closeness, and density of the graph.
We used an econometrics analysis to validate the association between selected features from graph metrics and purchase behavior. Our results show that the selected variables for website browsing patterns are significantly associated with customer purchase behavior in a given session (see more details in Table B1, Appendix B). This means that graph metric-based browsing patterns of customers can reflect the sequential stages in the customer decision journey. Specifically, browsing patterns allow us to observe the customer’s complex navigation in relation to exploring information or narrowing down to purchasing products [42]. In addition, we extract aggregated session information (e.g., session length and time spent on session) as baseline session features that can be used for session-level purchase prediction [39].
3.3. Predictive analysis
Section titled “3.3. Predictive analysis”3.3.1. Predictive modeling approach
Section titled “3.3.1. Predictive modeling approach”After extracting features from both the transaction and clickstream datasets, we conducted analyses to predict purchase behavior at the session level. For comparative analysis, this study employed various ML and DL algorithms. Given the complexity of the customer decision journey and the potential for nonlinear relationships between customer characteristics and purchase behavior [22,31], ML and DL algorithms are well-suited for this predictive modeling approach.
3.3.1.1. Machine learning algorithms. This study utilizes Logistic Regression (LR), Random Forest (RF), LightGBM (LGBM), and XGBoost (XGB) of ML algorithms. LR is a statistical method for predicting the likelihood of a binary event. The method uses a logistic (sigmoid) function to transform a linear combination of predictor variables into a value between 0 and 1, representing the estimated probability of the event occurring. It is used for linear simplicity and calculation efficiency by using a small number of hyperparameters. RF has an ensemble-based meta-learning form from several decision trees. It has the advantage of being particularly good at noise or outlier processing of predictor variables via random restoration extraction. LGBM is a leaf-wise learning method algorithm that continuously splits for leaf nodes with maximum loss without regard for tree balance. When dealing with highdimensional input data, this improves prediction while increasing efficiency and scalability. Internal cross-validation is performed by XGB using a boosting ensemble technique that weights learning errors in weak predictive tree models. This method has been widely used to reduce the overfitting regulation function.
3.3.1.2. Deep learning algorithms. Recent studies have actively utilized DL algorithms to predict the intricate and diverse behavior of online customers e.g., [35,53]. The advantage of DL algorithms lies in their capability to accurately predict by capturing nonlinear patterns within complex data [23]. This study employs the DL algorithms such as Multi-Layer Perceptron (MLP) and Tabular Network (TabNet). The MLP is a neural network model with hidden layers positioned between the input and output layers, operating in the sequence: input layer, hidden layer (s), and output layer. The connections in each layer are weighted and adjusted through activation functions like sigmoid and rectified linear
unit (ReLU), along with back-propagation, enabling the learning of nonlinear relationships. Additionally, we utilize TabNet, a recently introduced algorithm by Google’s research team. TabNet is an ensemble algorithm based on artificial neural networks (ANN) that leverages decision tree-based gradient boosting for efficient processing of tabular data [2]. TabNet represents the forefront of DL algorithms in recent tabular data competitions, exhibiting distinctive characteristics (for further details on TabNet, refer to Appendix C).
3.3.2. Model specifications
Section titled “3.3.2. Model specifications”To examine whether customer characteristics and browsing patterns have synergistic effects for predicting purchase behavior, we assess the prediction performance of the predictive analyses according to different dataset scenarios. Based on different combinations of the baseline, customer characteristics and browsing patterns, we use four different dataset scenarios (Table 4) as follows: First, Dataset 1 represents a baseline feature set comprising basic customer variables (Age, Gender, Tenure, Membership grade, Email and SNS) and session information variables (Session_Length, Ratio_custcenter, Ratio_cart, Ratio_search, Ratio_goods, Time_median, Time_std, Time_min, and Time*_max*). Dataset 2 entails both baseline features and the RFM factors as the variables for customer characteristics (Recency_Visit, Recency_Value, Frequency_Visit, Frequency_Value, and Monatory_Value). Dataset 3 comprise the baseline features and the variables for browsing patterns, including product-level graph metrics (Product_SelfLoops, Product_FlowHierarchy, Product_Density, Product_Closeness, Product_NodeBetweenness, Product_NeighborDegree, Product_NumberNodes, and Product_Eigenvector) and page-level graph metrics (Page_SelfLoops, Page_FlowHierarchy, Page_Density, Page_-Closeness, and Page_NodeBetweenness). Finally, Dataset 4 consists of variables from Dataset 2 and 3. We then compare the prediction model’s performances of the different scenarios.
4. Results
Section titled “4. Results”4.1. Prediction results
Section titled “4.1. Prediction results”We examined various configurations of the models used in our predictive analyses to optimize hyperparameter settings. Initially, each hyperparameter’s value was randomly generated five times. Subsequently, the parameter combination interval for models with highperformance Recall and F1-score was set. These parameters were then fine-tuned through 30 iterative adjustments. For the experiment,
Table 4 Dataset scenarios for predictive analysis.
| Scenario | Description (dimension) | Features |
|---|---|---|
| Dataset 1 | Baseline Features (15) | Age, Gender, Tenure, Membership, EMAIL, SMS, Session_Length, Ratio_custcenter, Ratio_cart, Ratio_search, Ratio_goods, Time_median, Time_std, Time_min, |
| Dataset 2 | Baseline Features (15) + Customer Characteristics (5) | Time_max, Baseline Features + Recency_Visit, Recency_Value, Frequency_Visit, Frequency_Value, Monatory_Value Baseline Features + Product_SelfLoops, |
| Dataset | Baseline Features (15) + | Product_FlowHierarchy, Product_Density, Product_Closeness, Product_NodeBetweenness, Product_NeighborDegree, |
| 3 | Browsing Patterns (13) | Product_NumberNodes, Product_Eigenvector, Page_SelfLoops, Page_FlowHierarchy, Page_Density, Page_Closeness, Page_NodeBetweenness |
| Dataset 4 | Baseline Features (15) + Customer Characteristics (5) + Browsing Patterns (13) | Baseline Features + Customer Characteristics + Browsing Patterns |
hyperparameters were identified using grid search and Bayesian search methods. A 5-fold cross-validation was performed to separate the training and validation datasets. Additionally, early stopping was employed to prevent overfitting. Table 5 presents the search spaces and the best hyperparameters used for each ML and DL model.
This study evaluates session-level purchase behavior on the test dataset using various ML and DL models across different dataset scenarios (Datasets 1–4). We employ metrics such as Recall, F1-score, and ROC-AUC4 to compare the prediction performances. Table 6 presents the results of session-level purchase behavior prediction. Notably, our analysis identifies Datasets 4 as yielding the best performance, which can be attributed to its comprehensive integration of both customer characteristics and browsing patterns. A comparison between Datasets 1 and Datasets 4 reveals a noteworthy enhancement in F1-score performance of up to 13%. Furthermore, when comparing the TabNet model from the DL algorithms to the LR model from the ML algorithms, we observe a 9% improvement in maximum performance for purchase behavior prediction. In summary, the findings emphasize the superiority of the DL models over the ML models in purchase behavior prediction, particularly given the intricate nature of customer behavior.
To understand how different variables play in predicting purchase behavior, we employed the permutation feature importance approach based on F1-score as the main performance. This approach is determined by measuring the extent to which a model’s performance drops when a feature is randomly removed. If the model’s performance decreases after removing a specific feature, it indicates that the feature has high importance. Table 7 presents the feature importance of the 10 most important features. Surprisingly, out of the top 10 features, 8 features are related to browsing patterns. This suggests that website browsing behaviors captured from clickstream data are more important for purchase behavior prediction than customer characteristics captured from transaction data. We also found that the time customers spent on the
Table 5 Hyperparameter search space and optimization.
| Model | Parameter search space | Best parameters | ||
|---|---|---|---|---|
| LR | C = logspace(0.01, 10), penalty = [L1,L2] | C = 5, penalty = L2 | ||
| RT | n_estimators = [400, 2000], max_depth = [4, 16], max_samples = [0.5, 1], max_features = [0.5, 1] | n_estimators =1100, max_depth = 16, max_samples = 0.99, max_features = 0.5 | ||
| LGBM | num_leaves = [16, 1024], learning_rate = [0.0001, 0.1], max_depth = [4, 16], n_estimators = [400, 2000], Subsample = [0.5, 1], colsample_bytree = [0.5, 1], reg_lambda = [0, 50] | num_leaves =800, learning_rate = 0.01, max_depth = 12, n_estimators = 1100, Subsample = 0.85, colsample_bytree = 0.8, reg_lambda = 47 | ||
| XGB | n_estimators = [400, 2000], max_depth = [4, 16], learning_rate = [0.0001, 0.1], min_child_weight = [0,3], Subsample = [0.5, 1], colsample_bytree = [0.2, 1], Gamma = [0,100] | n_estimators = 900, max_depth = 11, learning_rate = 0.05, min_child_weight = 0.13, Subsample = 0.9, colsample_bytree =0.5, Gamma = 17 | ||
| MLP | hidden_layer_sizes = [512, 256, 128 32], Activation = [ReLU, logistic, tanh], Solver = [adam, sgd, lbfgs], Alpha = [0.0001, 0.001, 0.01], learning_rate = [constant, adaptive] | hidden_layer_sizes = [512, 256, 128], Activation = ReLU, Solver = adam, Alpha = 0.0001, learning_rate = adaptive | ||
| TabNet | n_d = [8, 64], n_steps = [3, 10], step_size = [2, 50], Gamma = [0.8, 2.0], n_independent = [1, 5], n_shared = [1, 5], Momentum = [0.001, 0.1], lambda_sparse = [0.01, 0.1] | n_d = 64, n_steps = 3, step_size =27, Gamma = 0.8, n_independent =1, n_shared = 1, Momentum = 0.001, lambda_sparse = 0.01 |
Table 6 Prediction results for ML and DL models across dataset scenarios.
| Scenario | Metrics | ML model | DL model | ||||
|---|---|---|---|---|---|---|---|
| LR | RF | LGBM | XGB | MLP | TabNet | ||
| Recall | 0.77 | 0.56 | 0.37 | 0.31 | 0.47 | 0.71 | |
| Dataset 1 | F1- score | 0.37 | 0.47 | 0.43 | 0.39 | 0.47 | 0.46 |
| ROC-AUC | 0.85 | 0.89 | 0.90 | 0.90 | 0.90 | 0.89 | |
| Recall | 0.79 | 0.59 | 0.41 | 0.37 | 0.57 | 0.74 | |
| Dataset 2 | F1- score | 0.40 | 0.50 | 0.47 | 0.45 | 0.51 | 0.49 |
| ROC-AUC | 0.87 | 0.91 | 0.92 | 0.92 | 0.91 | 0.91 | |
| Recall | 0.83 | 0.55 | 0.41 | 0.38 | 0.59 | 0.64 | |
| Dataset 3 | F1- score | 0.44 | 0.52 | 0.48 | 0.47 | 0.53 | 0.53 |
| ROC-AUC | 0.90 | 0.92 | 0.93 | 0.93 | 0.92 | 0.92 | |
| Recall | 0.84 | 0.58 | 0.46 | 0.44 | 0.59 | 0.71 | |
| Dataset 4 | F1- score | 0.46 | 0.53 | 0.52 | 0.52 | 0.55 | 0.55 |
| ROC-AUC | 0.91 | 0.92 | 0.94 | 0.94 | 0.93 | 0.93 |
Table 7 Top 10 predictive variables ranked by feature importance.
| Category | Variable | Weight | ||
|---|---|---|---|---|
| Baseline Features | Session_Length | 0.3204 ± 0.0035 | ||
| Page_FlowHierarchy | 0.2266 ± 0.0042 | |||
| Page_Closeness | 0.1707 ± 0.0021 | |||
| Product_Closeness | 0.1601 ± 0.0036 | |||
| Browsing Patterns | Page_Density | 0.1601 ± 0.0010 | ||
| Page_SelfLoops | 0.1418 ± 0.0016 | |||
| Product_Density | 0.1131 ± 0.0019 | |||
| Baseline Features | Ratio_cart | 0.1081 ± 0.0016 | ||
| Product_Eigenvector | 0.0960 ± 0.0012 | |||
| Browsing Patterns | Product_NodeBetweenness | 0.0833 ± 0.0022 |
website and the ratio of adding items to the cart are strong predictors of purchase behavior. These insights deepen our understanding of the role of browsing patterns in purchase behavior prediction and enable us to offer targeted marketing suggestions to specific customers during their visits.
4.2. Clustering analysis: session-level customer segmentation
Section titled “4.2. Clustering analysis: session-level customer segmentation”To suggest customer segmentation strategies, this study proposed customer segmentation at the session level. We employed the K-means clustering algorithm based on the combined features, customer characteristics and browsing patterns. The K-means clustering is well-suited in our context in that it has been widely used in various customer segmentation studies due to its efficiency and performance of learning e.g., [33,36,42]. To conduct K-means clustering, we first preprocessed the input features by normalizing variables of customer characteristics and browsing patterns. Then, this study used the elbow method to determine the optimal number of clusters. We found that the optimal number of clusters was four clusters. Lastly, we compared this segmentation with customer characteristics-based segmentation and derived four sessionlevel customer types from the K-means clustering result.
To compare the proposed segmentation approach with prior customer characteristics-based segmentation [49], we replicated Kmeans clustering at the customer level solely based on RFM factors. Table 8 presents the distribution of session purchase conversion rates of clusters in both approaches. We found a clear gap in the purchase conversion rate distribution among clusters in the two approaches. While customer characteristics-based segmentation shows similar purchase conversion rates in a given session except for one cluster with the rate of 13%, our approach makes a relatively distributed and sharply separated purchase conversion rates among the clusters. This implies that our approach offers more fine-grained segments than traditional methods, enabling e-commerce platforms to establish customized marketing strategies effectively.
4 ROC-AUC stands for area under the receiver operating characteristic curve.
Table 8 Comparison of purchase conversion rate of segmentation approaches.
| Cluster | Customer characteristics-based segmentation approach | Our segmentation approach | ||||||
|---|---|---|---|---|---|---|---|---|
| Cluster 1 | Cluster 2 | Cluster 3 | Cluster 4 | Cluster 1 | Cluster 2 | Cluster 3 | Cluster 4 | |
| Proportion Purchase Conversion Rate | 0.19 13% | 0.47 4% | 0.29 5% | 0.05 5% | 0.32 0% | 0.18 18% | 0.16 24% | 0.35 4% |
We also derived four customer types from the results of customer segmentations. Table 9 presents a summary of each cluster and its description. Cluster 1 comprises 32% of the total segmentation sample and represents the second most common customer type, with the smallest purchase conversion rate among the clusters. Most recently and frequently visited the platform but have a lower frequency of purchases compared to other clusters with similar visitation frequencies such as Clusters 2 and 4. Notably, Cluster 1 is distinguished by an absence of product browsing patterns, despite the average page views of 10 in the session. Rather than browsing products, customers in this cluster are more likely to search for events or promotions within their preferred categories. These customers also spend less time on the website and have shorter average pageviews than the other segments. That is, Cluster 1 primarily revolves around exploring promotions rather than in-depth product exploration. Prior literature labeled these types of browsing patterns as shallow/touching base and promotion finder [36,42,46]. Based on these traits, we label this segment as “Promotion Seeker” for the context of segment-based marketing.
Cluster 2 accounts for 18% of the segmentation sample and has the second-highest purchase conversion rate. This cluster also spends less time browsing the website but exhibits the highest frequency of purchases and the greatest monetary value over the past 8-week period. This suggests recent loyalty to the platform. Customers in this cluster tend to take rapid actions during each page visit, as evidenced by their relatively short average session times. However, given a high value in metrics like product neighbor degree and product self-loops, customers in this segment are more likely to engage in intricate product comparisons adjacent to their search items. These browsing patterns often lead to immediate purchase decisions while focusing on exploring and comparing key products. According to Moe [42], this type of customers can be classified as a mix of directed buying and hedonic browsing. This insight underlines the need for tailored marketing strategies, perhaps encouraging shifts in purchasing behavior through product recommendations. Consequently, we identify this segment as “Premium Seeker” for customized segment marketing.
Cluster 3 accounts for 16% of the segmented sample and exhibits the highest conversion rate. Furthermore, customers within this cluster comprise a group that visits the website less frequently and has older purchase dates. This cluster primarily consists of new customers with relatively low purchase amounts over an eight-week period. These customers tend to meticulously explore various products during each page visit. In comparison to Cluster 2, this segment demonstrates lower values for the product number node and higher values for the product flow hierarchy. This browsing pattern suggests a focused approach towards key products and culminates in deliberate purchase decisions. This behavior aligns with the attributes of the type (i.e., search and deliberate), underscoring a thoughtful comparison of products [42]. Consequently, considering the highest conversion rate, Cluster 3 necessitates concentrated management efforts to nurture them into valuable customers. In this context, the cluster for segment-based marketing is designated as ” Attention Seeker.”
Cluster 4 is the largest part of the sample, at 35%, and it also has the second lowest conversion rate. Nevertheless, the amount of purchases, along with the current frequency of visits and purchases, is sizable. This indicates that this cluster has considerable potential. Similar to Cluster 3, customers in this cluster are characterized by a low product number of nodes and a product high flow hierarchy, so customers are the type to browse deliberately. However, the difference is that customers carefully consider a variety of products rather than comparing specific products, as evidenced by their low product self-loops and eigenvectors. The browsing patterns of this cluster indicate goal-oriented behavior, spending more time to reduce the number of products. These behaviors are consistent with previously found typologies (e.g., search/vetting and knowledge building) [36,42,46]. Therefore, this cluster may benefit from leveraging review information related to products to convert prospects into buyers. Accordingly, in customized marketing, this customer segment is labeled as “Information Seeker.”
This study demonstrated that predictive analysis can effectively identify customers with a high purchase conversion probability and clustering analysis can delineate distinct customer segments at the session level, respectively. Furthermore, we suggest how these two analyses can be combined to enhance decision support for e-commerce platforms. They can formulate marketing strategies for each segment. Then, they specify which segment-based marketing strategies should be targeted
Table 9 Description and results of customer segments.
| Cluster description | ||||||
|---|---|---|---|---|---|---|
| Cluster 1 | Cluster 2 | Cluster 3 | Cluster 4 | |||
| Promotion seeker | Premium seeker | Attention seeker | Information seeker | |||
| Session_Length | 10.09 | 13.35 | 12.08 | 19.75 | ||
| Baseline Features | Average time on session | 27.11 | 30.81 | 33.86 | 36.68 | |
| Recency_Visit | 2.92 | 4.50 | 25.97 | 3.75 | ||
| Recency_Value | 15.85 | 14.72 | 54.44 | 13.67 | ||
| Customer Characteristics | Frequency_Visit | 2.85 | 2.76 | 1.24 | 2.88 | |
| Frequency_Value | 6.41 | 8.59 | 0.24 | 7.89 | ||
| Monetary_Value | 128,611 | 156,595 | 3,663 | 154,639 | ||
| Product_NumberNodes | 0.00 | 11.17 | 7.28 | 3.87 | ||
| Product_SelfLoops | 0.00 | 0.87 | 0.43 | 0.00 | ||
| Product_FlowHierarchy | 0.00 | 0.51 | 0.70 | 1.00 | ||
| Product_Density | 0.00 | 0.54 | 0.58 | 0.70 | ||
| Browsing Patterns | Product_NeighborDegree | 0.00 | 1.23 | 0.80 | 0.31 | |
| Product_Closeness | 0.00 | 0.28 | 0.31 | 0.38 | ||
| Product_NodeBetweenness | 0.00 | 0.16 | 0.13 | 0.10 | ||
| Product_Eigenvector | 0.00 | 0.26 | 0.13 | 0.00 |
towards which customers in each segment depending on the purchase conversion probability during the time of visit.
5. Discussion and conclusion
Section titled “5. Discussion and conclusion”5.1. Key findings
Section titled “5.1. Key findings”Given the low conversion rates among online shoppers, a comprehensive understanding of purchase behavior is pivotal for e-commerce platforms. This is particularly important given the invaluable capability for accurately predicting purchase behavior. With this understanding, ecommerce platforms can enhance marketing efficiency through personalized services or recommendations that target customers with a high intent to purchase.
Our study first emphasizes the importance of measuring customer characteristics and browsing patterns comprehensively, based on the customer decision journey. Previous studies have typically relied on aggregated clickstream data and have not adequately addressed the intricacies of browsing behavior [1]. However, by employing RFM and graph metrics, we were able to comprehensively measure both types of variables. This approach provided us with a reliable basis for assessing its influence on both purchase behavior prediction and clustering analysis.
We then demonstrate a significant improvement in the performance of purchase behavior prediction when using combined features related to customer characteristics and browsing patterns. In terms of variable importance, it was confirmed that browsing patterns have higher weight scores than other features related to baseline and customer characteristics. It can be interpreted that browsing patterns can contribute significantly to purchase prediction. Moreover, our prediction results reveal the superiority of advanced DL models in predicting purchase behavior. This can be attributed to the efficiency of DL algorithms in learning and capturing nonlinear relationships within the data.
Our study emphasizes the potential to enhance customer segmentation by incorporating both customer characteristics and browsing patterns, as opposed to traditional customer-level segmentation methods. Additionally, we identified four session-level customer segments based on these two types of variables. Our findings reveal distinctions between the session-level segments we propose and the browsing pattern types suggested in previous studies [42]. This not only deepens our understanding of customer visiting intent but also extends customer-level segmentation that has focused on understanding long-term customer value.
5.2. Limitations and future research
Section titled “5.2. Limitations and future research”The study’s limitations and future research directions are discussed as follows. First, the probability of purchasing behavior was calculated at the session level using customer characteristics and browsing patterns. However, there is a limitation to purchasing prediction in that previous session browsing patterns were not used. Future research can solve the purchase prediction modeling problem using a sequentialbased RNN algorithm that incorporates data from previous sessions. Second, to extract variables on online customer behavior, this study focused on RFM factors and graph metrics but did not reflect product characteristics such as brands categories. When distinguishing intrinsic characteristics such as search goods and experience goods in the case of online products, it can have a significant effect on consumers’ behavior and purchase decision-making in an online shopping environment [13,25].
5.3. Implications for research
Section titled “5.3. Implications for research”This study has several important implications for research. First, this study contributes to the decision support literature on purchase behavior prediction by bridging the gap in both research and practice. Extant research suggest that additional features from different sources can yield richer information [1,35]. However, prior research on purchase prediction has either not modeled customer characteristics and browsing patterns at the same time [3,49], or analyzed them with a simple aggregation of browsing behavior [9]. Also, the managerial significance of understanding the various facets of a customer decision journey has been raised. To fill these gaps, our work focuses on how the combined features of customer characteristics and browsing patterns—extracted from different data sources—and empirically demonstrates the enhancement in prediction performance for session-level purchase behavior.
Second, this study provides methodological insights into extracting website browsing patterns as well as predicting purchase behavior. Previous research has not adequately captured the dynamics of customer website navigating but used basic features by aggregating browsing information of a session [9,38]. In contrast, we introduce a novel approach to extract browsing patterns by capturing the dynamic interactions between webpages within a session. Specifically, we employ graph theory [21] to capture nuanced browsing patterns in the form of graph structures. We then select specific graph metrics that align with website browsing typologies [46]. This conceptually-grounded approach is to offer a more intricate representation of browsing patterns. Our study empirically shows the effectiveness of these graph metrics in enhancing predictive performance, compared to that with basic session features. Furthermore, we assess various analytical techniques for predicting e-commerce purchase behavior. Given the emphasis on advanced methods [16], we comparatively evaluate ML and DL models across various dataset scenarios. TabNet emerges as the most effective, showing the highest predictive power for e-commerce purchase behavior. These findings guide future research in utilizing diverse data sources for predictive studies in similar contexts.
Third, this study extends the theoretical understanding of customer decision journeys in the context of e-commerce. Previous studies on purchase behavior prediction have empirically utilized various features concerning the customer decision journey, but they lack a theoretical underpinning [9,61]. We have adopted the AIDA model to examine the complementary effects of two behavioral variables (i.e., customer characteristics and browsing patterns) in customer decision journey for customer purchase prediction. Drawing on this theoretical foundation and prior literature, we argue that customer characteristics can implicitly shape preferences by influencing entire stages of the customer journey and website browsing patterns can explicitly reflect the stage of the customer journey. Our predictive analysis demonstrates that features related to customer characteristics and browsing patterns indeed influence purchase behavior prediction.
5.4. Implications for practice
Section titled “5.4. Implications for practice”Our study holds various practical implications. First, our findings of predictive analysis provide a crucial insight for online retailers to harness diverse features related to customer characteristics and browsing patterns, enabling more accurate predictions of purchase behavior. The resulting increase in predictive accuracy empowers them to precisely target customers, generate more leads, and ultimately convert these leads into sales. For customers with a higher likelihood of purchasing, promotions can be offered to expedite conversion. Conversely, customers with lower likelihood of purchasing can be presented with different product recommendations to enhance their potential to make a purchase. Thus, marketing managers can employ our predictive approach to tailor marketing promotions and incentives based on purchase predictions, leading to heightened shopping satisfaction and an improved purchase conversion rate [5].
Second, our session-level customer segmentation approach is integrated into a real-time recommender system. Unlike traditional segmentation methods that solely focus on customer characteristics, our approach combines browsing patterns and existing website typologies to
elucidate visit intentions, resulting in the identification of four distinct session-level customer segments. Since browsing behavior is a repetitive exploration process, we can deduce customers’ product choice [34]. Specifically, at the session level, we measure browsing behavior as an indicator of interest and connect favored products to the recommender system. This strategy involves recommending substitute or complementary products based on customers’ browsing patterns, which prove effective for both customers and e-commerce platforms by enhancing overall purchase conversion rate.
Third, understanding website browsing patterns enhances the seamless management of customer journeys on e-commerce platforms. Previous literature has mainly focused on customer-level segmentation based on demographics and RFM-related factors, often overlooking dynamic customer behavior during the time of visit [62]. Our approach, which incorporates two distinct types of variables, offers advanced decision support for managing customer journeys on e-commerce platforms. Specifically, this approach enables platforms to develop segmented marketing strategies by comprehensively understanding customer behavior during visits. Additionally, e-commerce platforms can identify likely buyers within each segment to target with specialized marketing strategies. Our study illuminates the customer decisionmaking journey in online shopping, thereby reducing uncertainty surrounding complex decision processes.
Acknowledgements
Section titled “Acknowledgements”This work was supported by the National Research Foundation of Korea(NRF) grant funded by the Korea government(MSIT) (No. NRF-2022R1F1A1073133).
Appendix A. Additional tables
Section titled “Appendix A. Additional tables”Table A1 Customer browsing type and related graph metrics.
| Browsing type | Description | Related graph metrics |
|---|---|---|
| Search/ Deliberation | This pattern involves users who have a general idea of what they are looking for, but they may not have settled on a specific product or brand. They are likely to spend more time comparing products, reading reviews, and gathering information. | FlowHierarchy Density Closeness Eigenvector |
| Directed buying | Directed buying is characterized by repeated search of the same product and low diversity of browsing products as “goal-oriented behavior.” Users in this pattern move to their desired product quickly and complete the purchase, and the average amount of time spent on a page is shorter than other types. | NumberNodes FlowHierarchy NodeBetweenness NeighborDegree NumberNodes |
| Hedonic browsing | As “exploration-oriented behavior”, hedonic browsing explores product categories over a wide range of areas. Users engaging in hedonic browsing may not have a specific product in mind but browse for the pleasure and are likely to show the lowest conversion rate. | SelfLoops Closeness Density |
Table A2 Description of variables.
| Variable | Description |
|---|---|
| Recency_Visit | Number of days between the previous visit and the current visit (session access) |
| Recency_Value | Number of days between the previous purchase and the current session access |
| Frequency_Visit | Number of visits during the past 8 weeks based on the current session access |
| Frequency_Value | Number of purchases during the past 8 weeks based on the current session access |
| Monatory_Value | Total spending amount during the past 8 weeks based on the current session access |
| Age | Customer age |
| Gender | 1 if a customer is female and 0 otherwise |
| Tenure | Number of days after signing up for the e-commerce platform |
| Membership grade | Customer rating within the e-commerce platform ranging from general (1) to gold (3) |
| 1 if a customer allows to receive email from the platform and 0 otherwise | |
| SMS | 1 if a customer allows to receive SMS from the platform and 0 otherwise |
| Product_SelfLoops | Indicator of repetitive behavior within the navigation flow of a node (product) |
| Product_FlowHierarchy | Ratio of simple search in products and indicators of goal-oriented search behavior |
| Product_Density | Indicator of complexity in the process through the degree of connection between products |
| Product_Closeness | Indicator of the average distance between the products explored |
| Product_NodeBetweenness | Indicator that can measure the behavior of exploring comparison with other products |
| Product_NeighborDegree | Indicator for how active navigation is for adjacent products |
| Product_NumberNodes | Indicator of how many products are explored within a single session |
| Product_Eigenvector | Centrality degree within a product is explored to determine if there is an important product |
| Page_SelfLoops | Indicator of repetitive behavior within the navigation flow of a node (page) |
(continued on next page)
Table A2 (continued)
| Variable | Description Ratio of simple search in pages and indicators of goal-oriented search behavior | ||
|---|---|---|---|
| Page_FlowHierarchy | |||
| Page_Density | Indicator of complexity in the process through the degree of connection between pages | ||
| Page_Closeness | Indicator of the average distance between the pages explored | ||
| Page_NodeBetweenness | Indicator that can measure the behavior of exploring comparison with other pages | ||
| Session_Length | Total length of a session | ||
| Ratio_custcenter | Percentage of visits to Customer Center pages in a session | ||
| Ratio_cart | Percentage of visits to Cart pages in a session | ||
| Ratio_search | Percentage of visits to Search pages in a session | ||
| Ratio_goods | Percentage of visits to Product pages in a session | ||
| Time_median | Median of the time duration of pageviews in a session | ||
| Time_std | Standard deviation of the time duration of pageviews in a session | ||
| Time_min | Min of the time duration of pageviews in a session | ||
| Time max | Max of the time duration of pageviews in a session |
Appendix B. Econometric validation
Section titled “Appendix B. Econometric validation”A logistic regression model was used to assess how customer characteristics extracted from RFM and consumer browsing patterns extracted from graph metrics influence online purchase behavior. The specification of our logit model is as follows:
(1)
where i represents a customer and j denotes a session. The dependent variable, , indicates whether customer i makes a purchase in session j. Customer is a vector of 5 customer characteristics at session j of customer i. Browsing is a vector containing 13 browsing pattern features extracted from graph metrics at session j of customer i. Baseline indicates a vector of 15 baseline features (see more details of variables in Table 5). indicates an error term.
Table B1 shows the impacts of features of customer characteristics and browsing patterns on purchase behavior. First, we observed that the pseudo R-squared value of the baseline model with customer characteristics is 0.0289 in Column 1, but increases to 0.1215 and 0.4493 after adding customer characteristics and browsing patterns, respectively (Columns 2 and 3). Upon combining the two types of features, the pseudo R-squared value researches 0.47 (Column 4). In addition, we find that all features of customer characteristics and browsing patterns are statistically significant. Lastly, by using Akaike information criterion (AIC) and the Bayesian information criterion (BIC), our results show that the combined model has superior performance, even when penalized for its complexity, supporting that the improvement is not merely due to the increase in the number of variables.
Table B1
Result of impact of customer characteristics and browsing patterns on purchasing.
| DV: | (1) Purchasing | (2) | (3) | (4) | |||
|---|---|---|---|---|---|---|---|
| Purchasing | Purchasing | Purchasing | |||||
| Recency_Visit | -0.0073*** | (0.0002) | -0.0025*** | (0.0002) | |||
| Recency_Value | 0.0177*** | (0.0002) | 0.0138*** | (0.0003) | |||
| Frequency_Visit | -0.2821*** | (0.0022) | -0.2440*** | (0.0032) | |||
| Frequency_Value | 0.0284*** | (0.0003) | 0.0231*** | (0.0004) | |||
| Monatory_Value | -0.0336*** | (0.0009) | -0.0184*** | (0.0012) | |||
| Product_SelfLoops | 0.2706*** | (0.0069) | 0.2682*** | (0.0071) | |||
| Product_FlowHierarchy | -0.2063*** | (0.0116) | -0.2213*** | (0.0121) | |||
| Product_Density | 0.4833*** | (0.0180) | 0.3692*** | (0.0181) | |||
| Product_Closeness | 5.4761*** | (0.0469) | 5.6423*** | (0.0473) | |||
| Product_NodeBetweenness | 0.9505*** | (0.0585) | 0.8506*** | (0.0597) | |||
| Product_NeighborDegree | 0.8997*** | (0.0154) | 0.8330*** | (0.0156) | |||
| Product_NumberNodes | 0.0341*** | (0.0006) | 0.0322*** | (0.0006) | |||
| Product_Eigenvector | -0.2136*** | (0.0336) | -0.2389*** | (0.0343) | |||
| Page_SelfLoops | -0.1621*** | (0.0034) | -0.1638*** | (0.0035) | |||
| Page_FlowHierarchy | -4.9341*** | (0.0233) | -4.8933*** | (0.0234) | |||
| Page_Density | -2.6198*** | (0.0156) | -2.5321*** | (0.0156) | |||
| Page_Closeness | -8.3028*** | (0.0598) | -8.3370*** | (0.0605) | |||
| Page_NodeBetweenness | -14.4328*** | (0.0779) | -14.1129*** | (0.0790) | |||
| Baseline Features | Yes | Yes | Yes | Yes | |||
| Pseudo R-Squared | 0.0289 | 0.1215 | 0.4493 | 0.47 | |||
| AIC | 1,603,684 | 1,450,721 | 908,465 | 875,294.7 | |||
| BIC | 1,603,768 | 1,450,864 | 908,704.8 | 875,594.4 | |||
| Observations | 1,191,203 | 1,191,203 | 1,191,203 | 1,191,203 |
Robust standard errors in parentheses.
Appendix C. Tabular network
Section titled “Appendix C. Tabular network”Fig. C1 presents the DNN architecture for tabular data, TabNet, suggested by Google’s research team [2]. The TabNet is made up of three
components: a feature transformer that encodes an input variable, an attentive transformer that generates a mask by receiving the encoded result, and a mask that contains variable usability information.
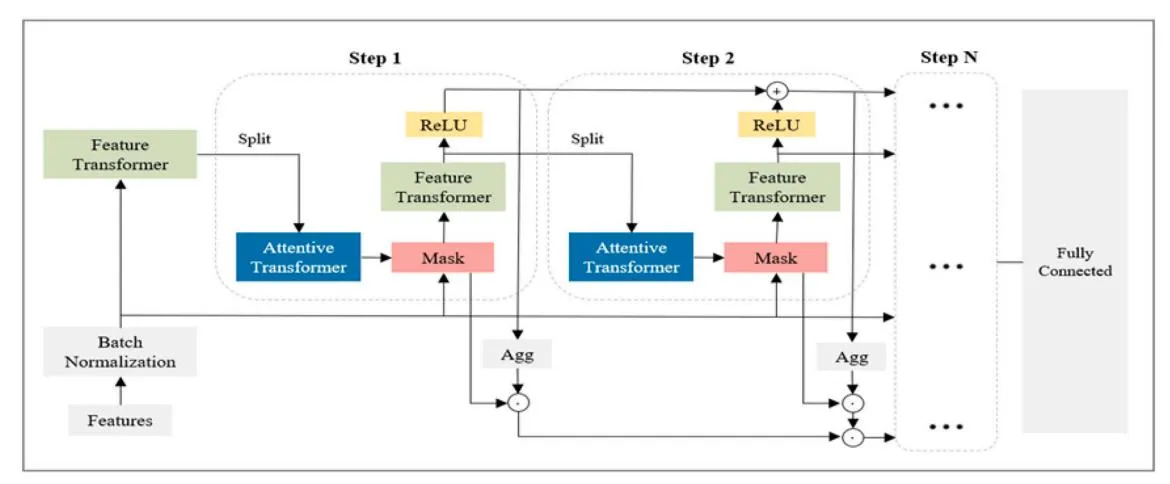
Fig. C1. Structure of tabular network.
For each step, the feature transformer result is passed through the ReLU function, linearly combined, and the final predicted value is calculated using a fully connected layer. Feature transformer is made up of four layers of fully connected, batch normalization, and gated linear unit blocks. The first two layers are shared for mutually dependent semantic inference across all decision steps, while the last two layers allow for independent semantic inference across all decision steps. Fully connected, batch normalization, and sparsemax are the components of the attentive transformer. Sparsemax is a nonlinear normalization function that projects into a sparse space at each variable selection step to increase the scarcity of the mask. TabNet has a gradient boosting structure that complements the residuals. The attractive transformer loss function is as follows:
\tag{1}
(2)
(3)
where Nsteps means the number of sequential steps. B is the batch size, and D is the number of characteristics of the input data. means the mask matrix of the step, and is the hyper parameter for numerical stability. is fully connected and batch normalization’s weight parameter, a[i-1] is masked characteristics, and is characteristic flexibility hyper parameter.
TabNet emphasizes attentive, interpretable features to identify crucial variables. Unlike traditional methods, which are limited in their functional flexibility, TabNet can model more intricate relationships within data sets. It not only effectively identifies important features but also learns how to combine them. This makes it particularly suitable for integrating different data sources by giving specific weights to individual features. In the context of our study, the unique capabilities of TabNet allow it to capture the complex behaviors of online customers, thereby improving prediction performance.
References
Section titled “References”-
[1] P. Adamopoulos, A. Ghose, V. Todri, The impact of user personality traits on word of mouth: text-mining social media platforms, Inf. Syst. Res. 29 (3) (2018) 612–640.
-
[2] S.Ö. Arik, T. Pfister, TabNet: attentive interpretable tabular learning, Proc. AAAI Conf. Artif. Intell. 35 (8) (2021) 6679–6687.
-
[3] A. Baumann, J. Haupt, F. Gebert, S. Lessmann, Changing perspectives: using graph metrics to predict purchase probabilities, Expert Syst. Appl. 94 (2018) 137–148.
-
[4] R.E. Bucklin, C. Sismeiro, A model of web site browsing behavior estimated on clickstream data, J. Mark. Res. 40 (3) (2003) 249–267.
-
[5] A.H. Busalim, F. Ghabban, Customer engagement behaviour on social commerce platforms: an empirical study, Technol. Soc. 64 (2021), 101437.
-
[6] H. Byeon, Evaluating the online buying behavior using network analysis, Int. J. Adv. Comput. Technol. 5 (12) (2013) 209.
-
[7] P. Chandon, B. Wansink, G. Laurent, A benefit congruency framework of sales promotion effectiveness, J. Mark. 64 (4) (2000) 65–81.
-
[8] S.R. Chandukala, J.P. Dotson, J.D. Brazell, G.M. Allenby, Bayesian analysis of hierarchical effects. Mark. Sci. 30 (1) (2011) 123–133.
-
[9] N. Chaudhuri, G. Gupta, V. Vamsi, I. Bose, On the platform but will they buy? Predicting customers’ purchase behavior using deep learning, Decis. Support. Syst. 149 (2021). 113622.
-
[10] D. Di Fatta, D. Patton, G. Viglia, The determinants of conversion rates in SME ecommerce websites, J. Retail. Consum. Serv. 41 (2018) 161–168.
-
[11] A.W. Ding, S. Li, P. Chatterjee, Learning user real-time intent for optimal dynamic web page transformation, Inf. Syst. Res. 26 (2) (2015) 339–359.
-
[12] R. Esmeli, M. Bader-El-Den, H. Abdullahi, An analyses of the effect of using contextual and loyalty features on early purchase prediction of shoppers in ecommerce domain, J. Bus. Res. 147 (2022) 420–434.
-
[13] T. Girard, P. Dion, Validating the search, experience, and credence product classification framework, J. Bus. Res. 63 (9–10) (2010) 1079–1087.
-
[14] S. Gupta, D.R. Lehmann, J.A. Stuart, Valuing customers, J. Mark. Res. 41 (1) (2004) 7–18.
-
[15] R.J. Harrington, M.C. Ottenbacher, K.W. Kendall, Fine-dining restaurant selection: direct and moderating effects of customer attributes, J. Foodserv. Bus. Res. 14 (3) (2011) 272–289.
-
[16] X. Hu, Q. Huang, X. Zhong, R.M. Davison, D. Zhao, The influence of peer characteristics and technical features of a social shopping website on a consumer’s purchase intention, Int. J. Inf. Manag. 36 (6, Part B) (2016) 1218–1230.
-
[17] H.M. Huynh, L.T. Nguyen, B. Vo, Z.K. Oplatková, P. Fournier-Viger, U. Yun, An efficient parallel algorithm for mining weighted clickstream patterns, Inf. Sci. 582 (2022) 349–368.
-
[18] C. Janiszewski, The influence of display characteristics on visual exploratory search behavior, J. Consum. Res. 25 (3) (1998) 290–301.
-
[19] Y. Jiang, J. Shang, Y. Liu, J. May, Redesigning promotion strategy for e-commerce competitiveness through pricing and recommendation, Int. J. Prod. Econ. 167 (2015) 257–270.
-
[20] W. Jo-Ting, L. Shih-Yen, W. Hsin-Hung, A review of the application of RFM model, Afr. J. Bus. Manag. 4 (19) (2010) 4199–4206.
-
[21] P.J. Kalczynski, S. Senecal, J. Nantel, Predicting on-line task completion with clickstream complexity measures: a graph-based approach, Int. J. Electron. Commer. 10 (3) (2006) 121–141.
-
[22] S. Karimi, C.P. Holland, K.N. Papamichail, The impact of consumer archetypes on online purchase decision-making processes and outcomes: a behavioural process perspective, J. Bus. Res. 91 (2018) 71–82.
-
[23] K. Khare, O. Darekar, P. Gupta, V. Attar, Short term stock price prediction using deep learning, in: 2017 2nd IEEE International Conference on Recent Trends in Electronics, Information & Communication Technology (RTEICT), IEEE, 2017, pp. 482–486.
-
[24] E. Kim, W. Kim, Y. Lee, Combination of multiple classifiers for the customer’s purchase behavior prediction, Decis. Support. Syst. 34 (2) (2003) 167–175.
-
[25] Y. Kim, R. Krishnan, On product-level uncertainty and online purchase behavior: an empirical analysis, Manag. Sci. 61 (10) (2015) 2449–2467.
-
[26] D. Koehn, S. Lessmann, M. Schaal, Predicting online shopping behaviour from clickstream data using deep learning, Expert Syst. Appl. 150 (2020), 113342.
-
[27] A. Lambrecht, C. Tucker, When does retargeting work? Information specificity in online advertising, J. Mark. Res. 50 (5) (2013) 561–576.
-
[28] R.J. Lavidge, G.A. Steiner, A model for predictive measurements of advertising effectiveness, J. Mark. 25 (6) (1961) 59–62.
-
[29] A.Y. Lee, P.A. Keller, B. Sternthal, Value from regulatory construal fit: the persuasive impact of fit between consumer goals and message concreteness,
-
J. Consum. Res. 36 (5) (2010) 735–747. [30] K.N. Lemon, P.C. Verhoef, Understanding customer experience throughout the
-
customer journey, J. Mark. 80 (6) (2016) 69–96. [31] C.-Y. Li, The more, the better? Why abundant information leads to unanticipated
-
outcomes, Telematics Inform. 33 (3) (2016) 834–847. [32] H. Li, P. Kannan, Attributing conversions in a multichannel online marketing environment: an empirical model and a field experiment, J. Mark. Res. 51 (1)
-
(2014) 40–56. [33] N. Li, D.D. Wu, Using text mining and sentiment analysis for online forums hotspot
-
detection and forecast, Decis. Support. Syst. 48 (2) (2010) 354–368. [34] R. Lian, The construction of personalized web page recommendation system in ecommerce, in: 2011 International Conference on Computer Science and Service
-
System (CSSS), IEEE, 2011, pp. 2687–2690. [35] Q. Lin, N. Jia, L. Chen, S. Zhong, Y. Yang, T. Gao, A two-stage prediction model based on behavior mining in livestream e-commerce, Decis. Support. Syst. (2023) 114013.
-
[36] F. Liu, R. Wang, P. Zhang, M. Zuo, A Typology of Online Window Shopping Consumers, 2012.
-
[37] Y. Liu, Y. Xue, D. Xu, R. Cen, M. Zhang, S. Ma, L. Ru, Constructing a reliable web graph with information on browsing behavior, Decis. Support. Syst. 54 (1) (2012) 390–401.
-
[38] X. Lu, S. He, S. Lian, S. Ba, J. Wu, Is user-generated content always helpful? The effects of online forum browsing on consumers’ travel purchase decisions, Decis. Support. Syst. 137 (2020), 113368.
-
[39] G. Mallapragada, S.R. Chandukala, Q. Liu, Exploring the effects of “What”(product) and “Where”(website) characteristics on online shopping behavior, J. Mark. 80 (2) (2016) 21–38.
-
[40] J. Marbach, C.R. Lages, D. Nunan, Who are you and what do you value? Investigating the role of personality traits and customer-perceived value in online customer engagement, J. Mark. Manag. 32 (5–6) (2016) 502–525.
-
[41] B. Martinez, S. Kim, Predicting purchase intention for private sale sites, J. Fash. Mark. Manag.: Int. J. 16 (3) (2012) 342–365.
-
[42] W.W. Moe, Buying, searching, or browsing: differentiating between online shoppers using in-store navigational clickstream, J. Consum. Psychol. 13 (1) (2003) 29–39.
-
[43] O. Mokryn, V. Bogina, T. Kuflik, Will this session end with a purchase? Inferring current purchase intent of anonymous visitors, Electron. Commer. Res. Appl. 34 (2019), 100836.
-
[44] S. Moro, P. Cortez, P. Rita, Using customer lifetime value and neural networks to improve the prediction of bank deposit subscription in telemarketing campaigns, Neural Comput. & Applic. 26 (2015) 131–139.
-
[45] N. Oly Ndubisi, Effect of gender on customer loyalty: a relationship marketing approach, Mark. Intell. Plan. 24 (1) (2006) 48–61.
-
[46] J.I. Pallant, P.J. Danaher, S.J. Sands, T.S. Danaher, An empirical analysis of factors that influence retail website visit types, J. Retail. Consum. Serv. 39 (2017) 62–70.
-
[47] P. Pirolli, Information Foraging Theory: Adaptive Interaction with Information/ Peter Pirolli, Oxford University Press, New York, 2007.
-
[48] P. Pirolli, S. Card, Information foraging, Psychol. Rev. 106 (4) (1999) 643.
-
[49] M.A. Rahim, M. Mushafiq, S. Khan, Z.A. Arain, RFM-based repurchase behavior for customer classification and segmentation, J. Retail. Consum. Serv. 61 (2021), 102566.
-
[50] P. Sorce, V. Perotti, S. Widrick, Attitude and age differences in online buying, Int. J. Retail Distrib. Manag. 33 (2) (2005) 122–132.
-
[51] D.W. Stephens, J.R. Krebs, Foraging Theory, Princeton university press, 1986.
-
[52] E.K. Strong, Theories of selling, J. Appl. Psychol. 9 (1) (1925) 75–86.
-
[53] C. Sun, P. Adamopoulos, A. Ghose, X. Luo, Predicting stages in omnichannel path to purchase: a deep learning model, Inf. Syst. Res. 33 (2) (2021) 429–445.
-
[54] T. Tong, X. Xu, N. Yan, J. Xu, Impact of different platform promotions on online sales and conversion rate: the role of business model and product line length, Decis. Support. Syst. 156 (2022), 113746.
-
[55] S.K. Trivedi, P. Patra, P.R. Srivastava, J.Z. Zhang, L.J. Zheng, What prompts consumers to purchase online? A machine learning approach, Electron. Commer. Res. (2022) 1–37.
-
[56] Y. Trope, N. Liberman, C. Wakslak, Construal levels and psychological distance: effects on representation, prediction, evaluation, and behavior, J. Consum. Psychol. 17 (2) (2007) 83–95.
-
[57] D. Van den Poel, W. Buckinx, Predicting online-purchasing behaviour, Eur. J. Oper. Res. 166 (2) (2005) 557–575.
-
[58] L. Weng, Z. Huang, J. Bao, A model of tourism advertising effects, Tour. Manag. 85 (2021), 104278.
-
[59] X. Xu, T. Schrier, Hierarchical effects of website aesthetics on customers’ intention to book on hospitality sharing economy platforms, Electron. Commer. Res. Appl. 35 (2019), 100856.
-
[60] J. Xun, Revisiting the two-stage choice model: an empirical study of consumer choice on brand website visits, Behav. Inform. Technol. 33 (11) (2014) 1192–1207.
-
[61] J. Yeo, S.W. Hwang, K. S, E. Koh, N. Lipka, Conversion prediction from clickstream: modeling market prediction and customer predictability, IEEE Trans. Knowl. Data Eng. 32 (2) (2020) 246–259.
-
[62] Y. Zhang, E.T. Bradlow, D.S. Small, Predicting customer value using clumpiness: from RFM to RFMC, Mark. Sci. 34 (2) (2014) 195–208.
-
[63] Y. Zhang, M. Pennacchiotti, Predicting purchase behaviors from social media, in: Proceedings of the 22nd international conference on World Wide Web, 2013, pp. 1521–1532.
Seongbeom Kim is a PhD candidate at the Graduate School of Information of Yonsei University, Seoul Korea. His research interests focus on applied AI (deep learning), recommender systems, and data science. Specifically, he is interested in topics related to social media and customer behavior in e-commerce.
Woosik Shin is a PhD candidate at the Graduate School of Information of Yonsei University, Seoul Korea. His research interests focus on economics of IS. Specifically, he is interested in topics related to user engagement and behavior on social media and ecommerce.
Hee-Woong Kim is a Professor at the Graduate School of Information of Yonsei University, Seoul Korea. Before joining Yonsei University, he was a faculty member in the Department of Information Systems and Analytics at the National University of Singapore (NUS). He has served on the editorial boards of the MIS Quarterly, Journal of the Association for Information Systems, and IEEE Transactions on Engineering Management. His research work has appeared in Communications of the ACM, Decision Support Systems, European Journal of Operational Research, IEEE Transactions on Engineering Management, Information & Management, Information Systems Research, International Journal of Electronic Commerce, Journal of the Association for Information Systems, Journal of Management Information Systems, Journal of Retailing, and MIS Quarterly.