Prediction Model Of Optimal Bid Price Based On Keyword Auction Data Through Machine Learning Algorithms
Abstract. The RTB system is a bidding system for advertising in a specific area of on-line page. A typical RTB bidding system is a system provided by Google’s search engine. In this paper, we use the data of the Naver advertisement bidding, a representative Korean search engine operated by a private bidding for the RTB system. Especially, in case of online keyword advertisement, the rank can be important factor the online page when a user enters a certain keyword into a search engine. For example, if a search keyword is ranked at the top of an online page, the probability of bid being directly connected will be increased for the link of related keyword. Therefore, the bid price of the keyword is changed according to the rank of the search keyword. In the end, it is necessary to find an appropriate bid price for registering a keyword in a private bid system. In this paper, we propose a prediction modeling mechanism to predict optimal bid price of the keyword in a specific ranking of search engine. In order to predict the optimal bid price and advertising ranking on the online page, we perform feature engineering on the related data set and define the prediction model using the machine learning algorithms for the corresponding data set.
1 Introduction
Section titled “1 Introduction”The worldwide market for sponsored search advertising and display advertising reached $61 billion and billion $57.2 billion1, respectively, in 2015. In addition, an online advertising accounts for 49.7% of total advertising execution costs, of which 45.2% is used for the advertising of search engine. Therefore, a RTB (Real Time bidding) system is increasingly imposed as a bid solution for an advertisement execution [1,2]. If an advertiser wants to launched advertisements through the search engine, the RTB system will be used by search engines such as the Google Ad [3]. In case of South Korea, when an advertiser wants to launch
https://www.zenithmedia.com/zenithoptimedia-forecasts-4-1-growth-in-global-adspend-in-2013/.
© Springer International Publishing AG, part of Springer Nature 2019 L. Barolli et al. (Eds.): IMIS 2018, AISC 773, pp. 665–674, 2019. https://doi.org/10.1007/978-3-319-93554-6\_65
a search advertisement through the Naver search engine, the advertisement bid is generally executed through the RTB system named Naver Search AD. For example, when a keyword advertisement is executed using the Naver search AD, n (e.g., 0–20) ads may be executed for one search keyword. The ranking of the search keyword can vary depending on various factors including the bid price. The search keyword of insurance, for instance, can be have various bid prices according to each rank (e.g., $6 for 1st rank of the online page, $5 for 2nd rank of the online page, and $4 for 3rd rank of the online page, etc.). However, since the advertisement bid process is conducted privately as a blind competition (i.e., bids are mutually sealed and connot be shared among advertisers), it is difficult to know how much to bid for the advertisement at the desired rank. It is also difficult to predict bid prices because bid prices can form different prices for different time zones.
In this paper, we propose a feature engineering method that predicts bid price of keyword search advertisement and a prediction model of bid price using machine learning algorithms. In particular, we present the results of prediction model for bid price using the linear regression, logistic regression, softmax, and artificial neural networks (ANNs) in the Tensor Flow. Finally, we propose the most accurate and suitable model to predict the bid price of search advertisement in real time.
The rest of this paper is organized as the followings. Section 2 reviews relevant literature from several perspectives. Section 3 illustrates the construction of the proposed prediction model based on related variables. Section 4 presents the empirical results of applying the model to predict of a search keyword and compares those results with Tensor Flow methods. The final section summarizes the findings and discusses the potential extensions of the research.
2 Related Work
Section titled “2 Related Work”The keyword auction as a form of online advertisement offers good targeting, low cost, and easy scalability [4]. The keywords selected by the advertisers to represent characteristics of their products or services are associated with an ad that appears as a sponsored link (i.e., paid listing) at the right side of the result page in a search engine in response to users query. Given a similar quality score of the landing page (used by Google or Naver) the higher the ranking, the higher the price to pay because top positions typically elicit more clicks. Now empirical models that attempt to exhibit optimization and prediction of keywords auctions have also gained attention. To our knowledge, few papers directly discuss keyword data modeling, hence greatly motivating this research. Auerbach et al. who state that most advertisers on Yahoo use return on investment (ROI, popular performance metric used by advertising professionals)-based strategies, but others bid with second prices may not opt for them [5].
Unlike regular media advertising, the keyword advertisement provides information tailored to the purpose of individual consumers. An advertising expense is measured as a cost per click (CPC) cost when a consumer clicks on a link in a search result. The weighted-sum method is mainly used [3]. The ranking of keyword is mainly determined by taking into account the maximum bid price, the click rate, and other related factors. The CPC-based keyword advertisement has a cost advantage that the expenditure of the advertisement cost occurs only when the user clicks [3]. The keyword advertisement that bids a relatively high amount are ranked at the top of search engine. However, the cost per click (CPC), which is the actual cost of the advertising, can be different from the bid price offered in the keyword auction. As found by Stepanchuk [6], the same bids can result in different predicted positions under different response models. In terms of prediction robustness, the semilogarithmic model is reported to be much better than others, but it is insufficient to predict ROI because of its simplicity. However, a higher position does not necessarily incur more clicks if advertisers have different reputations [7], and different impression choices result in different click-through rates (CTR) within and across different ad channels [8]. Graepel et al. developed a Bayesian probit regression model to predict the CTR of paid search ads and obtain a good result [9]. However, the binary feature vectors associated with ad impressions may exclude some critical category variables (e.g., position) from the model. Also, the complicated factor-graph training creates greater difficulty in the parameters estimation. The aforementioned empirical research provides a sound basis to further explore ROI prediction in keyword auctions.
3 Prediction Model of Bid Price Through Machine Learning Algorithm
Section titled “3 Prediction Model of Bid Price Through Machine Learning Algorithm”3.1 Data Setup Procedure
Section titled “3.1 Data Setup Procedure”In order to collect keyword auction data, a crawling method is used from client nodes generated keyword search results. When multiple client nodes generate the same keyword search results, they will be stored as one keyword data value. At this time, the number of occurrences of the same keyword is counted and stored. All collected keyword data is stored through the main data server.
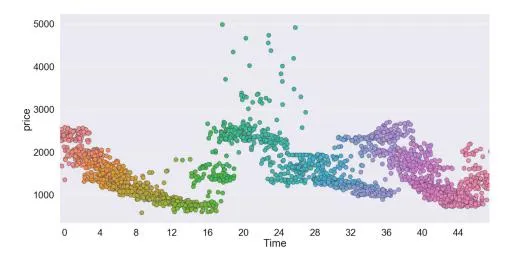
Fig. 1. Time series result of specific search keyword depends on price.
3.2 Data Feature Engineering
Section titled “3.2 Data Feature Engineering”Even though the keyword data is the same keyword, a price differential occurs with time. In particular, keyword data varies in price depending on weekdays and weekends. In addition, it can be seen that, even if the same keyword is used for 24 h, a large price differential occurs over time. Figure 1 shows that the price of the keyword data changes over a 24-h period. As a result, it is confirmed that time is a major factor in the prediction model. In this paper, we divide 24 h into 30 min and divide 48 time units into time data sets. To do this, 48 time data sets are implemented in the form of one-hot encoders. Since the language of keyword data in Korean needs to be processed, the keyword data is converted into numerical values using the word2vec library. Through this process, the keyword data set is composed of a combination of independent variables and dependent variables. The data set of x (e.g., input), which consists of independent variables, contains the value of the price and time, and the data set of y (e.g., output), which consists of the dependent variable, contains the rank value of the keyword data.
3.3 Constructing Machine Learning Algorithms for Keyword Auction
Section titled “3.3 Constructing Machine Learning Algorithms for Keyword Auction”We apply a hypothesis, loss function (or cost function) and optimizer to perform the machine learning modeling. In general, there are various optimization algorithms on which the gradient descent optimizer is based [10]. In this paper, we use the Adam algorithm for the optimization method. The learning rate is the process of finding the optimal solution that minimizes the loss function. When the learning rate is too large, overshooting can be occurred without converging to the optimal value, and when the learning rate is too small, the convergence rate will be too slow and the local minimum problem can be occurred. In this paper, we propose a process to find the appropriate learning rate with the Adam optimization algorithm.
In this paper, we analyze four machine learning algorithms to find the optimal bid price of keyword search advertisement. First, the linear regression algorithm is applied with the hypothesis and loss function. Second, we apply the logistic regression algorithm with the Sigmoid function instead of the multiple matrix. The logistic regression is, in principle, optimized for one class separation. In order to apply the multinomial classification form, third, we can apply the multinomial classification (i.e., softmax regression) algorithm. The multinomial classification algorithm is applied for the hypothesis and loss function as the same of logistic regression. However, the cross entropy is used for the loss function in the multinomial classification. Unlike these three algorithms, the ANN algorithm is based on the deep learning model. It is applied as a multilayer perceptron (MLP) with several layers in a perceptron composed of one layer. Basically, the ANN performs forward propagation by putting training data set into input to perceptron. In this case, the error value is calculated as the difference between the prediction value of the resultant Neural networks and the target value, and this can be referred to as the application of the back propagation (chain rule) algorithm. In MLP, it is expected that the accuracy will be improved by increasing the hidden layer. However, a vanishing gradient problem which may lose the previous slope value in the back propagation may occur. To do this, we apply the RELU function to solve the vanishing gradient problem. In this paper, we set the class value of input data to 151 (e.g., price (1), time set (48), weekdays or weekends (1), keyword name with word2vec (100)). When the input data comes out of the input layer and enters the first hidden layer, it comes out as 256 classes, which are then moved back into the second hidden layer. Likewise, we configure the third hidden layer to enter 256 classes, then configure the neural networks to output 15 class values as the rank of keyword search data from the output layer.
4 Extensive Simulation Results
Section titled “4 Extensive Simulation Results”Table 1 shows the experimental environment used to evaluate the performance of the prediction model for the keyword auction data. The keyword auction data set consists of about 9 million data, of which 70% is used for training data and 30% is used for test data. Figure 2 shows a sample for training data.
| Category | Value |
|---|---|
| OS | Windows 10 Pro |
| CPU | Intel Core i5-8500 2.80 GHz 64bit |
| GPU | GeForce GTX1070 EXOC D5 8 GB |
| Memory | 10 GB |
| Language | Python 3.6 |
| Library | Tensor Flow 1.7 |
Table 1. Simulation environment
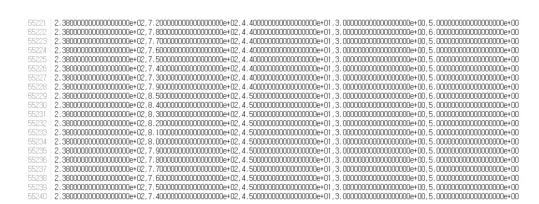
Fig. 2. An example of training dataset used experiments.
Figure 3(a) shows the accuracy of training data using the Adam optimization algorithm for the ANN. When the Adam optimization algorithm is applied, it can be seen that the accuracy increases step by step as the epoch increases.
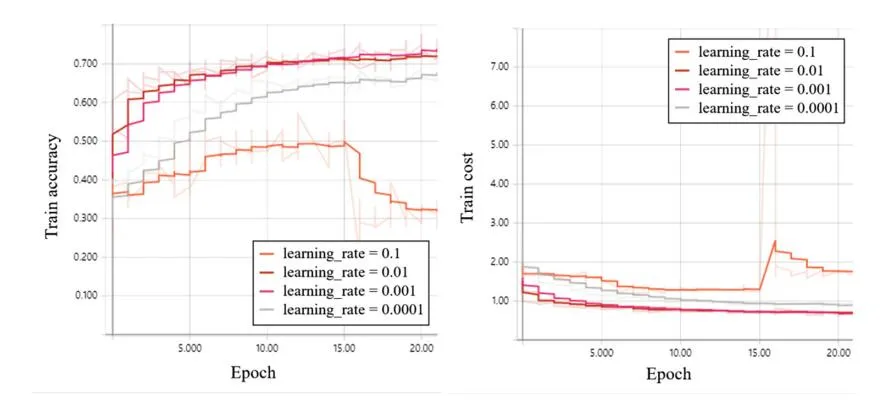
Fig. 3. (a) Simulation result of training accuracy in case of ANN with the Adam optimization algorithm, (b) Simulation result of training cost in case of ANN with the Adam optimization algorithm.
However, it can be seen that the optimum learning rate is applied to the Adam optimization algorithm to find the optimum result. For the accuracy of the training data in Fig. 3, it can be seen that the accuracy is highest when the learning rate is 0.001. In particular, when the learning rate is 0.01, the accuracy is reached quickly, but when the learning rate is 0.001, a higher accuracy is obtained.
Figure 3(b) shows the result of the cost function when the Adam optimization algorithm is applied to the ANN. It can be seen that the cost gradually reaches the minimum value as the Epoch increases. As the learning accuracy of the training accuracy is 0.001, it shows the highest accuracy and the cost result reaches the minimum value when the learning rate is 0.001. However, according to the result of Fig. 3(b), it can be seen that the learning rate converges to the minimum value faster when the learning rate is 0.01.
Figure 4(a) shows the accuracy of the test data set to determine the accuracy of the model. As shown in Fig. 3(a), we applied the Adam optimization algorithm and showed the highest accuracy when the learning rate was 0.01 and 0.001, respectively. Especially, when the learning rate is 0.01, it is found that the accuracy value is reached quickly.
Figure 4(b) shows the result of the cost function according to the test accuracy of the model. When the learning rate is 0.01 as same as the accuracy of the test data set as shown in Fig. 4(b), it can be seen that it converges to the minimum value.
Table 2 shows more detailed simulation results. As mentioned above, it can be seen that the accuracy and cost vary depending on the learning rate. In addition, when the learning rate is 0.01, the accuracy of the training data and the accuracy of the test data are the highest. Specifically, the test cost value reaches the minimum value when the learning rate is 0.01 and epochs is 10. As the epochs increase, the cost value increases again.
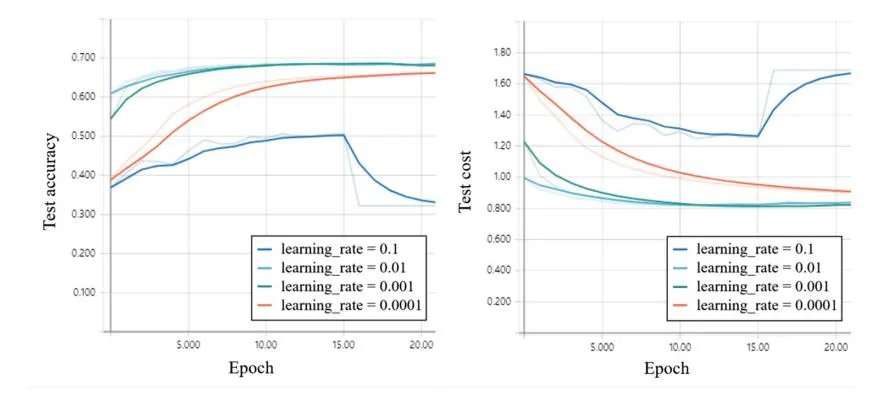
Fig. 4. (a) Simulation result of test accuracy in case of ANN with the Adam optimization algorithm, (b) Simulation result of test cost in case of ANN with the Adam optimization algorithm.
Table 2. Simulation results of ANN algorithm with the Adam optimization algorithm
| Learning rate | Epoch | Training accuracy | Training Cost | Test accuracy | Test cost |
|---|---|---|---|---|---|
| 0.1 | 5 | 0.461 | 1.523 | 0.463 | 1.365 |
| 0.1 | 10 | 0.473 | 1.343 | 0.495 | 1.292 |
| 0.1 | 15 | 0.520 | 1.259 | 0.505 | 1.255 |
| 0.01 | 5 | 0.682 | 0.779 | 0.675 | 0.846 |
| 0.01 | 10 | 0.719 | 0.706 | 0.686 | 0.819 |
| 0.01 | 15 | 0.713 | 0.696 | 0.682 | 0.822 |
| 0.001 | 5 | 0.679 | 0.837 | 0.671 | 0.863 |
| 0.001 | 10 | 0.710 | 0.772 | 0.685 | 0.818 |
| 0.001 | 15 | 0.705 | 0.756 | 0.685 | 0.812 |
| 0.0001 | 5 | 0.581 | 1.140 | 0.581 | 1.130 |
| 0.0001 | 10 | 0.654 | 1.000 | 0.640 | 0.991 |
| 0.0001 | 15 | 0.623 | 0.961 | 0.655 | 0.936 |
In this paper, the results of applying linear regression, logistic regression, and multinomial classification (softmax regression) are additionally described. In order to compare the results of the three regression algorithms, we applied the Adam optimization algorithm and applied the same learning rate of 0.01. Figure 5(a) compares the accuracy of training data according to the linear regression, logistic regression, and softmax regression. According to the results in Fig. 5(a), the accuracy of the training data shows that the multinomial classification algorithm has the highest accuracy. Figure 5(b) compares the accuracy of the test data for the three regression algorithms. According to the results
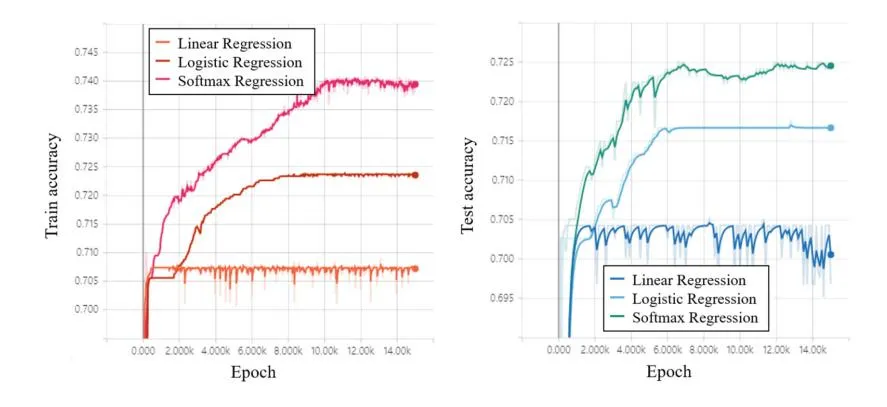
Fig. 5. (a) Simulation result of training accuracy in case of regression algorithms with the Adam optimization algorithm, (b) Simulation result of test accuracy in case of regression algorithms with the Adam optimization algorithm.
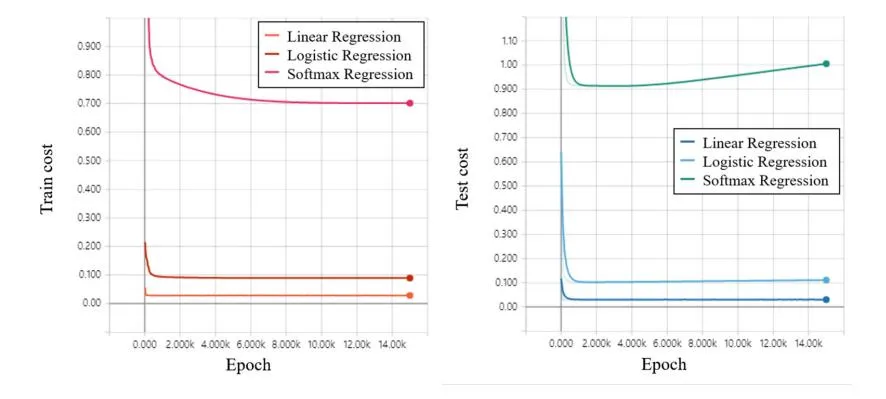
Fig. 6. (a) Simulation result of training cost in case of regression algorithms with the Adam optimization algorithm, (b) Simulation result of test cost in case of regression algorithms with the Adam optimization algorithm.
in Fig. 5(b), the accuracy of the test data and the multinomial classification algorithm show the highest accuracy.
Figure 6(a) and (b) show the cost of training data and the test data for the three regression algorithms, respectively. As a result, after finding the minimum value for each of the three regression algorithms, it can be seen that the cost increases again as the step increases. The cost values shown in Fig. 6(a) and (b) can be compared as an independent result for each algorithm. For example, the cost value for the test data of multinomial classification reaches a minimum at the step of 8000, and then the cost increases again. In addition, it can be confirmed that the cost value for the test data of the logistic regression reaches the minimum value at the step of about 670.
In this paper, we compare the price prediction results of keyword data by applying four algorithms. One of the typical algorithms of the deep learning, the ANN algorithm is applied to a total of 94,258 datasets and training data (65,980) and test data (28,278) are 70% and 30%, respectively. For the rest of the regression algorithms, we compare the results of pricing predictions using linear regression, logistic regression, and multinomial classification. The regression algorithm used 4,023 datasets in total, with training data (2,816) and test data (1,207) as 70% and 30%, respectively. As a result, in the case of the ANN algorithm, the accuracy of the training data is 77% and the accuracy of the test data is 68%. In the case of the regression algorithms, the accuracy of the training data is 74% and the accuracy of the test data is 71% on the average, depending on the algorithms. In general, the accuracy of the training data is estimated to be 75%, and the accuracy of the test data is estimated to be 70%. The accuracy of the training data is 75%, which indicates that the lack of data sets caused the underfitting problem. If we estimate the rank of the keyword data with a gap, we can derive a higher accuracy. Here, the meaning of gap means that mismatch is allowed for one rank. For example, in our prediction model that computes 15 rank outputs, it can be calculated with accuracy of zero gap to calculate exactly the third rank of the third rank prediction. If it is calculated with the accuracy of one gap, it means that the case where the third rank is predicted to the second or fourth rank also includes the accuracy. The reason why it is possible to allow a gap of one degree is because the rank of the keyword data continuously changes according to time, and the variation range shows the difference of one gap continuously. When the one gap is allowed for the accuracy, the accuracy of the ANN test data is 91.8%, the accuracy of the test data of the linear regression algorithms is 92%, the accuracy of the logistic regression algorithm and the softmax regression algorithm are 94%, respectively. As a result, it can be seen that accuracy is improved when a one gap is set for the degree of rank prediction.
Based on the results of this paper, we will extend the study to the result of solving the underfitting problem with additional data collection.
5 Conclusion
Section titled “5 Conclusion”In this paper, we compare the accuracy of bid price prediction results of keyword data by applying four algorithms: the ANN algorithm, linear regression algorithm, logistic regression algorithm, and multinomial classification algorithm. As a result, in the case of the ANN algorithm, the accuracy of the training data is 77% and the accuracy of the test data is 68%. In the case of the regression algorithms, the accuracy of the training data is 74% and the accuracy of the test data is 71% on the average, depending on the algorithms. In general, the accuracy of the training data is estimated to be 75%, and the accuracy of the test data is estimated to be 70%. The accuracy of the training data is 75%, which indicates that the lack of data sets caused the underfitting problem. Despite the underfitting problem, the accuracy of the training data and the accuracy of the test data are similar in this paper. This is an indication that the prediction model of the bid price in keyword data is being trained. We will collect the data sufficiently and draw out the results of applying these prediction models. In this paper, we also applied the Adam optimization algorithm to optimize the keyword data model suitable for the prediction of bid price. Although we did not mention due to paper limitation, we concluded that the Adam optimization algorithm is the most suitable for the prediction model of bid price for keyword data.
Acknowledgements. This work was supported by the Technology development Program (C0563763) funded by the Ministry of SMEs and Startups (MSS, Korea). The keyword data set for the simulation in this paper was supported by Taeseong Kim of the e-Glue communications.
References
Section titled “References”- 1. Hou, L.: A hierarchical bayesian network-based approach to keyword auction. IEEE Trans. Eng. Manag. 62, 217–225 (2015)
- 2. Lauritzen, S.: The EM algorithm for graphical association models with missing data. Comput. Stat. Data Anal. 19, 191–201 (1995)
- 3. Shuai, Y., Wang, J., Zhao, X.: Real-time bidding for online advertising: measurement and analysis. In: International Workshop on Data Mining for Online Advertising, Chicago, Illinois, USA (2013)
- 4. Brooks, N.: The Atlas rank report: How search engine rank impacts conversions (2004). http://www.atlasonepoint.com/pdf/AtlasRankReportPart2.pdf
- 5. Auerbach, J., Galenson, J., Sundararajan, M.: An empirical analysis of return on investment maximization in sponsored search auctions. In: International Workshop Data Mining and Audience Intelligence, Las Vegas, NV, USA (2008)
- 6. Stepanchuk, T.: An empirical examination of the relation between bids and positions of ads in sponsored search. In: 21st Bled eConference on eCollaboration: Overcoming Boundaries through Multichannel Interaction. Bled, Slovenia (2008)
- 7. Jerath, K., Ma, L., Park, Y., Srinivasan, K.: A position paradox in sponsored search auctions. Mark. Sci. 30, 612–627 (2011)
- 8. Gopal, R., Li, X., Sankaranarayanan, R.: Online keyword based advertising impact of ad impressions on own channel and cross channel click through rates. Decis. Support Syst. 52, 1–8 (2011)
- 9. Graepel, T., Candela, J., Borchert, T., Herbrich, R.: Web-scale Bayesian click through rate prediction for sponsored search advertising in Microsoft Bing search engine. In: International Conference on Machine Learning, Haifa, Israel (2010)
- 10. Kingma, D., Ba, J.: ADAM: a method for stochastic optimization. In: International Conference on Learning Representations, San Diego, CA, USA (2015)